Research papers
|
M&A Trends & Intelligence
.jpg)
Tariq Mooseajee
Thank you for taking the time to read this H2-2024 version of the UK&I M&A Monitor. This report consolidates research performed by Dealsuite, the leading UK&I and international platform for M&A transactions. It contains statistics and trends for the UK&I M&A mid-market (enterprises with a revenue between £1 million and £200 million) over the second half of 2024. Dealsuite contacted 431 M&A advisory firms operating within the UK&I M&A mid-market.The aim of this study is to create periodic insights that improve the UK&I’s market transparency and to serve as a benchmark for M&A professionals. We are convinced that sharing information within our network leads to improved quality and volume of deals.
The advisors who participated in this research were involved in the following number of transactions during the second half of 2024:

Some transactions included a respondent on both the sell and buy sides. As a result, the sell-side and buy-side transactions cannot be summed up to determine the total number of transactions.
After a turbulent period of high interest rates and inflation, 2024 brought a welcome shift in the market.The interest rate cuts earlier in the year contributed to an improved economic climate. In the first half of2024, we saw a modest uptick in both buy-side and sell-side transactions—a trend that continued through the second half. The gradual recovery of market confidence appears to be ongoing, laying the foundation for further growth in the sector. In H2-2024, the number of buy-side transactions significantly increased by 8%, while sell-side transactions rose by 4%.
The distribution of transactions completed across sectors in H2-2024 is shown in Figure 2. The IT Services sector experienced a further decline in closed transactions in H2-2024 compared to H1-2024, with a decrease of 3 percentage points. In contrast, the share of transactions in the Construction & Engineering sector rose to 15%. As in previous periods, the majority of transactions were closed in the BusinessServices sector.

Over half of the closed transactions in H1-2024 had a deal size above 5 million (51%). In H2-2024, the average transaction size increased again. 59% of transactions had a deal size of over 5 million. The percentage of transactions with a deal size below 2.5 million decreased by 3 percentage points to 28%.

Figure 4 shows the annual revenue of companies offered for sale on Dealsuite in H2-2024. Depending on the transaction timeline, some of these deals will be completed, while others may fall through in H1-2025.We can consider this data a tentative forecast of the size of companies likely to be sold in the coming quarters. The platform data for H2-2024 shows that 33% of the deals listed on Dealsuite have a turnover of between £1 million and £3 million. 28% of companies have a turnover of more than 10 million pounds. This data can be seen as a preliminary estimate of the size of companies that are likely to be sold in the coming quarters.
The revenue sizes posted on Dealsuite provide a fair representation of the market. Approximately 30% of the companies in Europe have a revenue over £10 million, aligning closely with the 28% of companies listed on Dealsuite. This demonstrates that the M&A industry has fully embraced online deal sourcing via Dealsuite.

The results are explained in more detail in Figure 5 below. These are assignments received in H2-2024and completed in H2-2024, however, it is worth noting that some of these projects may be completed during a later period or cancelled.
In H2-2024, 32% of advisors reported a similar number of transactions compared to H1-2024. 22% of advisors noticed a drop, while 46% of the advisors reported an increase in the number of assignments.

Sell-side advisors defined the average EBITDA multiple by industry. In this edition, the advisors were asked to revise the industry multiples from H1-2024. The results are shown in Figure 6.
The average EBITDA multiple increased again in H2-2024, rising from 5.2 to 5.35. Most sector multiples followed this upward trend, though the E-commerce & Webshops sector saw a slight decline from 6.7 to6.6, as did the Agri & Food sector, dropping from 5.6 to 5.5.

A sector can contain various types of companies with different characteristics. As a result, businesses within the same sector may have varying EBITDA multiples. Figure 7 shows the spread of EBITDA multiples per sector. For some sectors, a wider spread in EBITDA multiples is reported, compared to sectors that contain a higher proportion of similar companies. The results below are calculated using the standard deviation. Based on the research data, we can say with 95% confidence that the true value of the parameter lies within the bounds of the confidence interval.

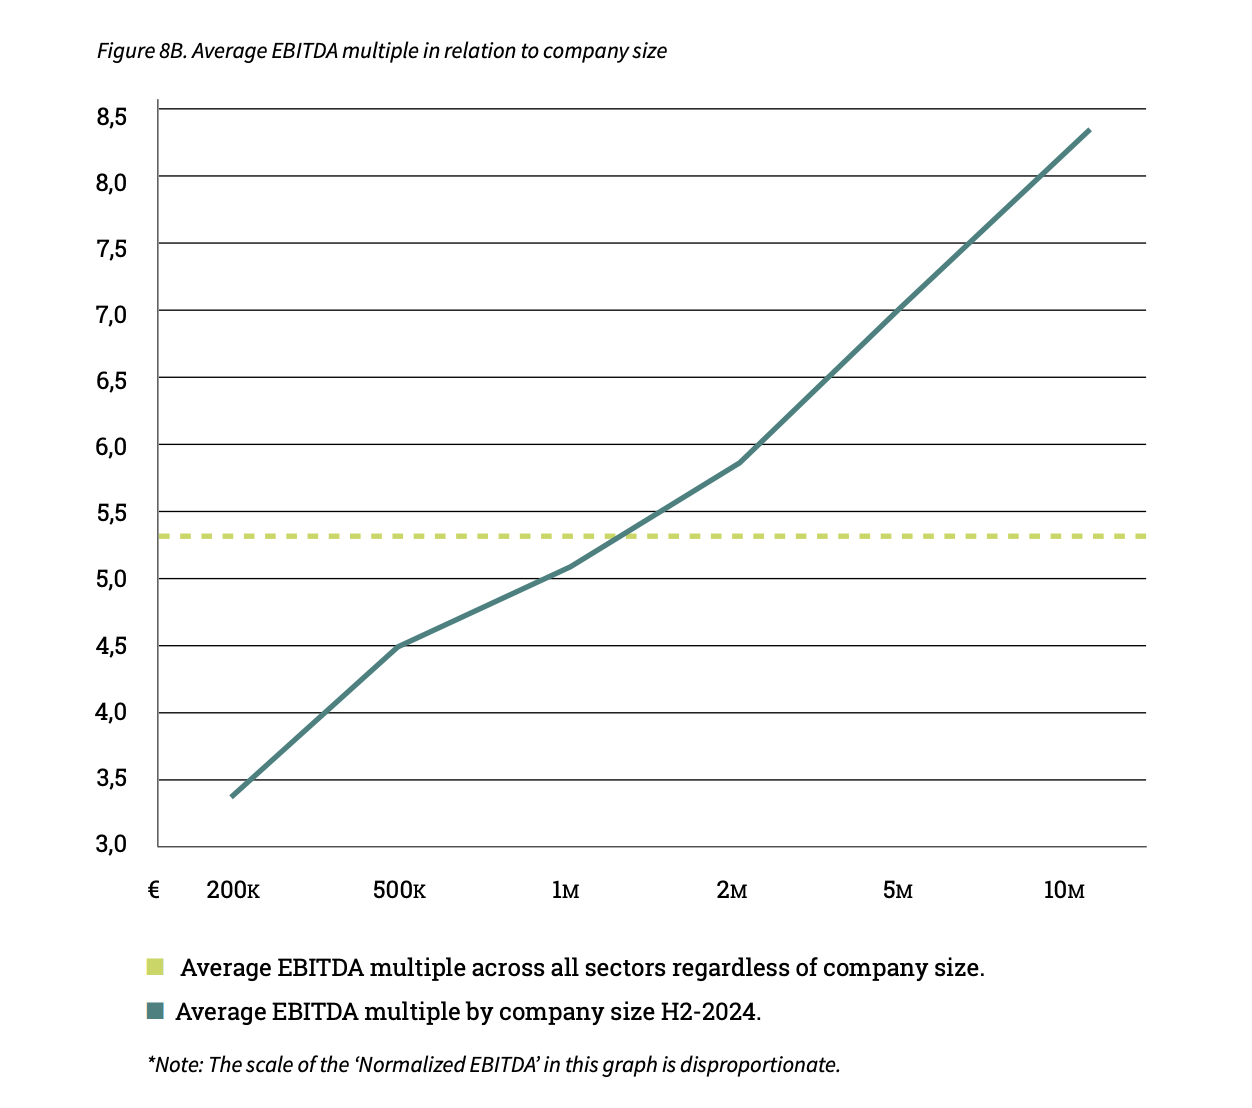
The size of a company plays a crucial role in determining multiples in business valuation. For small and medium-sized enterprises (SMEs) in the UK, it is essential to accurately quantify the impact of the SmallFirm Premium. This is particularly relevant for businesses with an EBITDA ranging from £200,000 to £10,000,000.
Studies have shown that smaller companies face a higher likelihood of not achieving their expected cashflows (Damodaran, 2011; Grabowski & Pratt, 2013). This can be attributed to factors such as reliance on specific customers or suppliers, or dependence on unique technical expertise that may be lost if key employees leave. Such vulnerabilities can significantly impact a company’s returns and, consequently, its valuation. The elevated risk premium associated with smaller businesses, known as the Small FirmPremium, leads to a reduction in value. As a result, EBITDA multiples for larger companies tend to be higher on average compared to those for smaller companies.
The results of this monitor survey confirm again that companies with a low EBITDA have a lower multiple than companies with a high EBITDA. The influence of company size on EBITDA multiples paid is presented in Figures 8A and 8B.
The difference in the EBITDA multiple between companies with a normalised EBITDA of £200,000 and£10,000,000 is 5.1 (3.3 compared to 8.4).


A comparison of EBITDA multiples between different countries highlights the advantages of cross-border deals. For example, it can be beneficial to buy a particular company abroad or to sell a company to an international buyer. Figure 9 shows the differences in EBITDA multiples between European markets.

In the current market, there is an average of 8.1 buyers per company listed for sale (Dealsuite Monitor,August 2024). However, not every sell-side assignment results in a successful deal. Figure 10 shows the most common reasons why sales processes are prematurely terminated.

54% of the advisors cite unrealistic valuation expectations from the seller as the main reason for deal terminations. 15% of advisors indicate that failure to secure suitable financing options is the main cause.

On average, 71% of sell side assignments result in a closed deal, while 29% of transactions are discontinued early. Compared to neighbouring countries, this is a relatively high success rate. For example, the success rate in the DACH region is lower at 62%, while in the CEE region, it stands at 59%.Recent findings indicate a shift in the success rates of M&A deals: of the 71% of sell side assignments that ultimately result in a transaction, an increasing proportion is considered successful. Twenty years ago, 70% of closed deals failed because the outcomes did not meet expectations, whereas today, an average of 70% of closed deals are deemed successful (Bain & Company, 2023). Several factors contribute to this improvement, including the fact that mergers and acquisitions are now more frequently pursued for diverse strategic purposes rather than solely for scaling and cost savings. This demonstrates that M&A, in most cases, genuinely creates value (Dealsuite Trends Report, 2024).
Assessing the performance of the UK&I M&A mid-market is based on many factors, including the willingness of entrepreneurs to sell their businesses, funding availability, macroeconomic developments, etc. An interpretation of these factors is needed to determine how the market will develop. The survey included both assessments of the M&A mid-market in H2-2024 (retrospective) and H1-2025 (projection).The vast majority of advisors look back on H2-2024 with satisfaction (74%). The outlook for H1-2025appears even more promising, with 77% of advisors expressing positive expectations.

The majority of M&A transactions take place in the mid-market. This M&A Monitor uses the definition of amid-market company as having a revenue between £1 and £200 million. The survey that formed the basis for this M&A Monitor was sent to 431 M&A advisory firms. Considering their combined input, they represent an essential part of the M&A mid-market in the UK&I. Out of the total of 431 advisory firms, we received 107 responses (25% response rate).
Sources used:
• 107 survey responses from senior managers of UK&I M&A advisory firms
• Bain & Company. (2023, March 28). How companies got so good at M&A.
• Dealsuite. (2024). M&A mid-market trends report 2024.• Dealsuite M&A Monitors 2015 - 2024
• Dealsuite transaction data 2015-2024• Field, A. (2011) Discovering Statistics SPSS. Third edition, SAGE publications, London. 1 -822
• Grabowski and Pratt (2013). Cost of Capital: Applications and Examples.
This research was conducted by Jelle Stuij, and Roos Bijvoet.
For further questions, please contact Tariq Mooseajee.

.png)


Grow your network. Find more deals.
Science Park 106
1098 XG Amsterdam
Netherlands
© 2026 Dealsuite. All rights reserved.


.png)