

Research papers
|

Jelle Stuij
Thank you for taking the time to read this fourth edition of the Nordic M&A Monitor. This report consolidates research performed by Dealsuite, the leading Nordic and international platform for M&A transactions. It contains statistics and trends for the Nordic M&A mid-market (enterprises with a revenue between €1 million and €200 million) over the first half of 2026.
Dealsuite contacted 295 M&A advisory firms operating within the Nordic M&A mid-market.
The aim of this study is to create periodic insights that improve the Nordic market's transparency and to serve as a benchmark for M&A professionals. We are convinced that sharing information within our network leads to an improved quality and volume of deals.
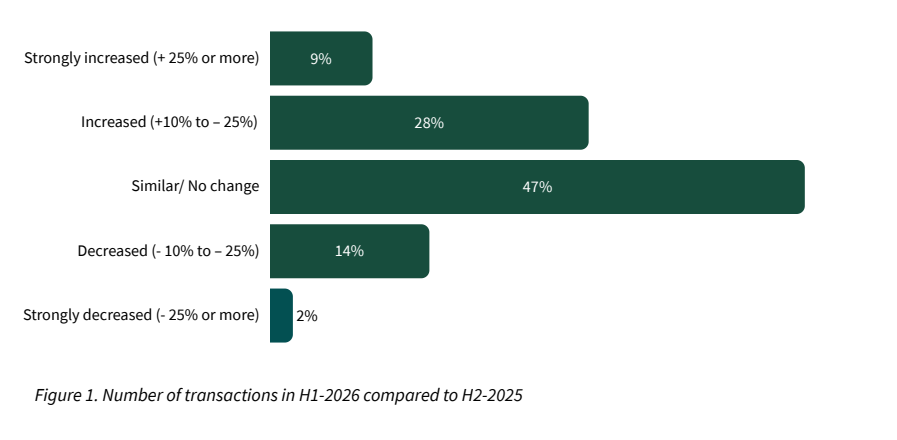
Transaction volume tilts positive in H1-2026
Uncertainty remains the new normal in the M&A market. Dealmakers in the Nordic mid-market have adapted accordingly: according to the Dealsuite M&A Deal Terms Report, deferred payments and other forms of risk-sharing between buyer and seller are being used increasingly often to keep transactions on track. That resilience shows up in the H1-2026 figures: 37% of advisors report an increase in transaction volume, against 16% reporting a decrease, building on the moderately positive sentiment already reported for H2-2025.
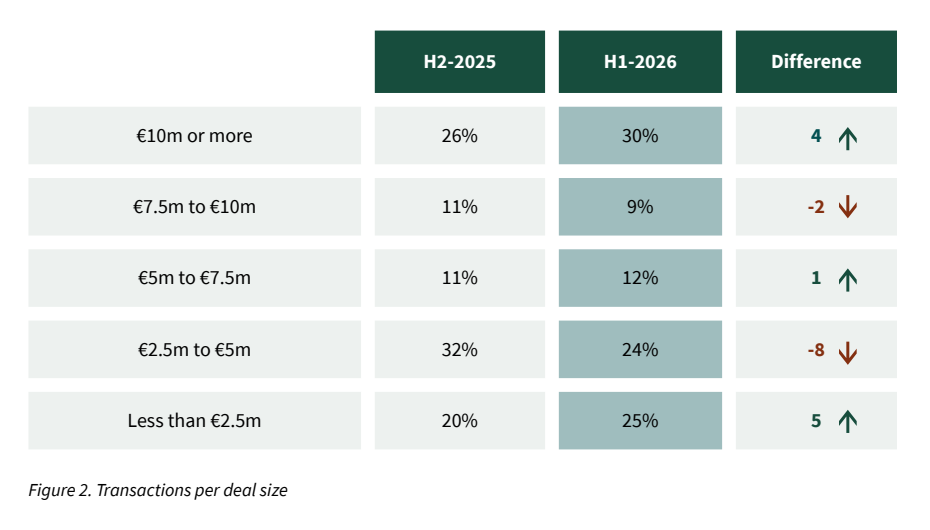
Increase in share of deals with a deal size above €10m
The deal mix has shifted toward both ends of the market. The share of deals above €10 million rose from 26% to 30%, a four percentage point increase, while deals in the €2.5 to €5 million segment fell sharply, from 32% to 24%. Deals below €2.5 million increased by 5 points to 25%, and the €5 to €7.5 million segment also grew, up 1 point.
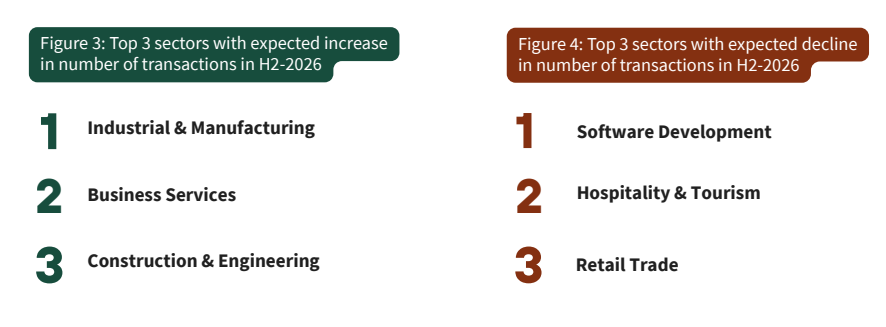
Industrial & Manufacturing holds the top spot for a third consecutive edition; Software Development flips from riser to decliner
To understand expected developments, M&A advisors were asked in which sector they foresee the largest increase or decrease in deal activity in H2-2026. Industrial & Manufacturing remains the most-cited sector for expected growth, a position it has now held for three consecutive editions. Business Services and Construction & Engineering round out the top three risers.
On the decline side, Software Development is the notable mover: after featuring among the expected risers in the previous three editions, it now tops the list of expected decliners, followed by Hospitality & Tourism and Retail Trade.
Assignment volumes continue to build
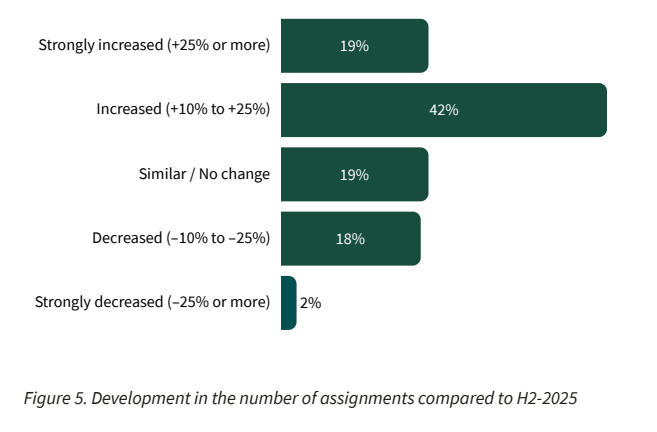
An increase or decrease in assignments received by advisory firms gives insight into expected deal flow and market sentiment. 61% of advisors report an increase in assignments (19% strongly increased, 42% increased), while 19% report a similar volume and 20% report a decrease.
Average EBITDA multiple holds steady at 5.4
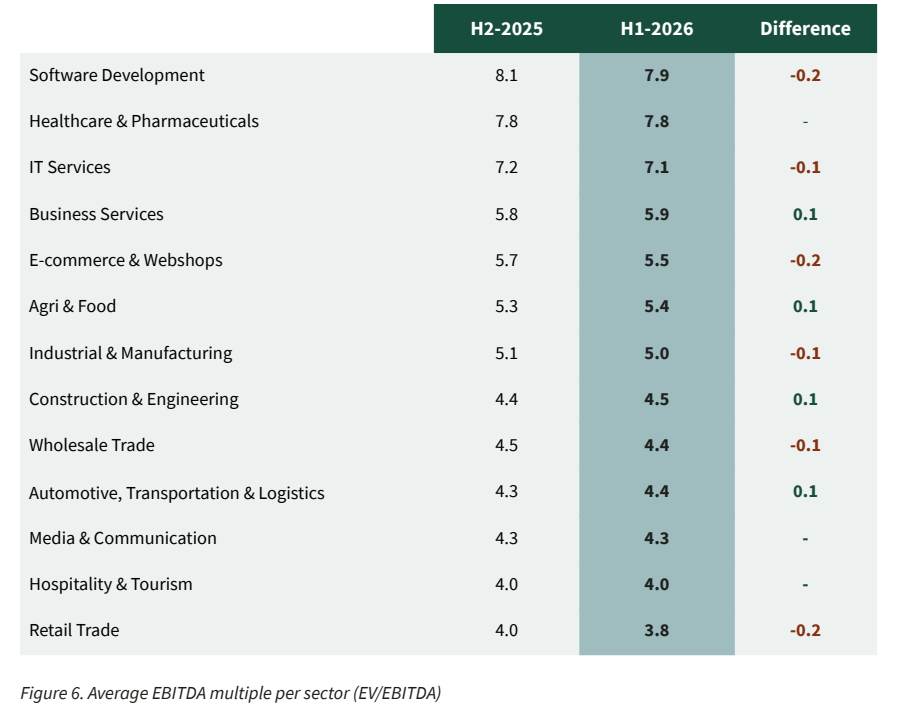
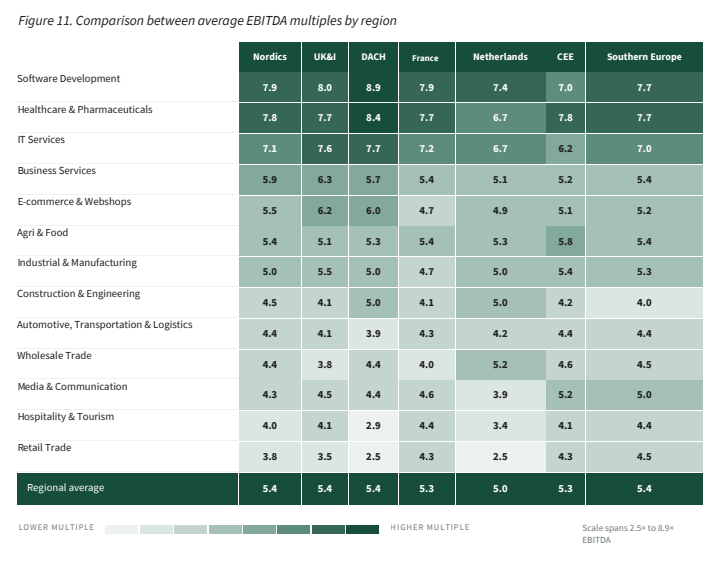
EBITDA multiples are widely used as a benchmark for business valuation, providing an indication of what buyers are willing to pay in specific sectors. The average EBITDA multiple across sectors held steady at 5.4, unchanged from H2-2025. Business Services, Agri & Food, Construction & Engineering, and Automotive, Transportation & Logistics each gained 0.1. Retail Trade recorded the lowest multiple in this edition at 3.8, down 0.2, alongside Software Development and E-commerce & Webshops, both also down 0.2.
Valuation ranges vary widely across sectors
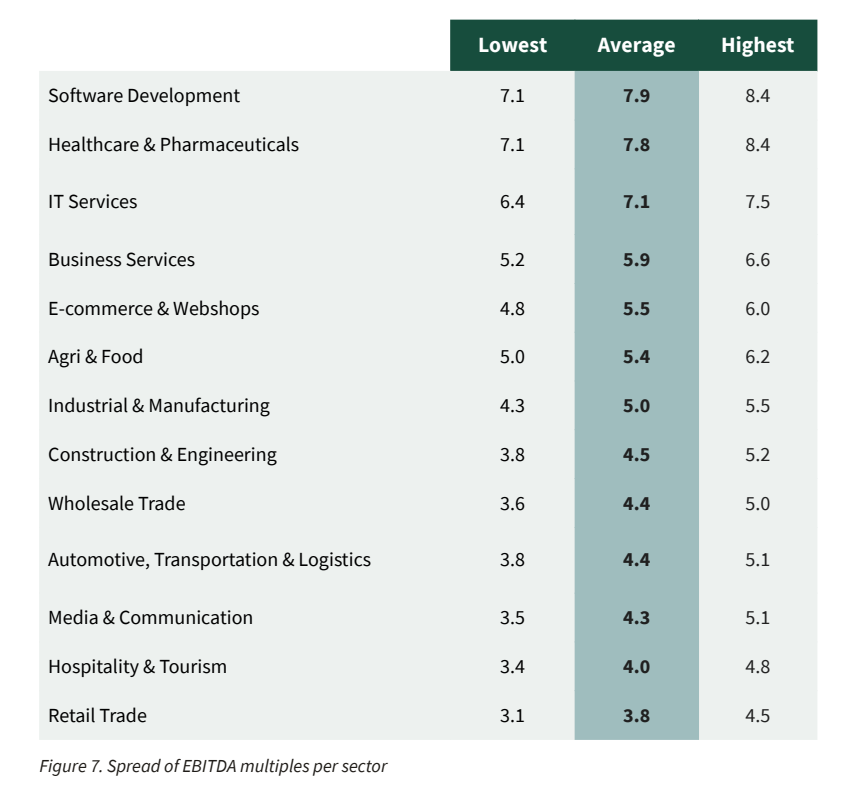
A business valuation is inherently company-specific and depends on a wide range of factors, including growth prospects, profitability, market position, and risk profile. Some sectors encompass a wide range of businesses with different characteristics, which explains why certain sectors show a larger spread than sectors made up of more similar companies, ranging from Retail Trade at the lower end to Software Development and Healthcare & Pharmaceuticals at the higher end.
Company size continues to drive valuation
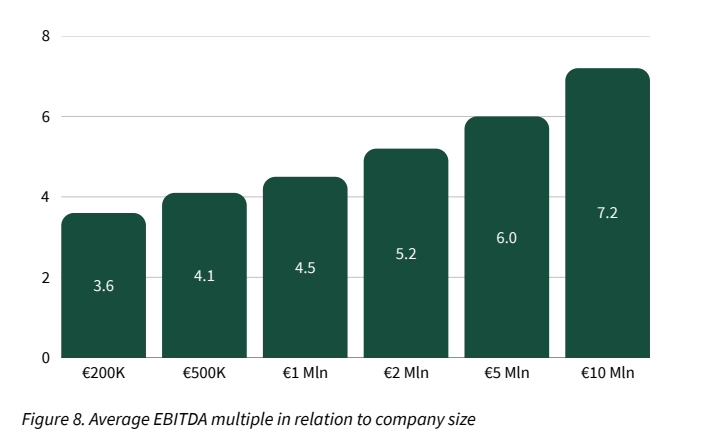
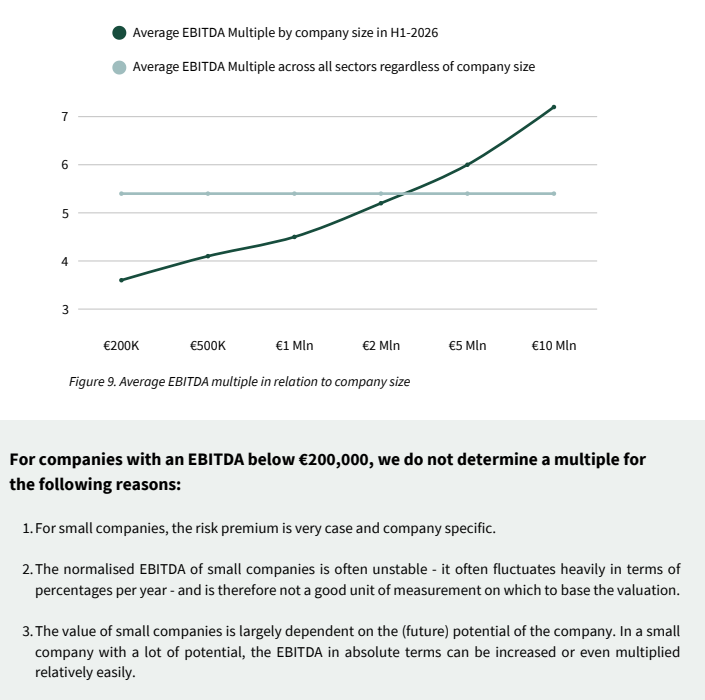
Company size remains a key driver of valuation. Research shows that smaller companies carry a higher risk of not realising expected free cash flows (Damodaran, 2011; Grabowski & Pratt, 2013). This higher risk profile is corrected for through the so-called Small Firm Premium, which results in a lower valuation. In H1-2026, multiples for the largest Nordic companies rose further, with the €10 million bracket up 0.2 to 7.2, while multiples for smaller companies eased slightly. The gap in EBITDA multiple between companies with a normalised EBITDA of €200,000 and €10,000,000 now stands at 3.6 (3.6 versus 7.2).
Regional valuations converge further toward the European average
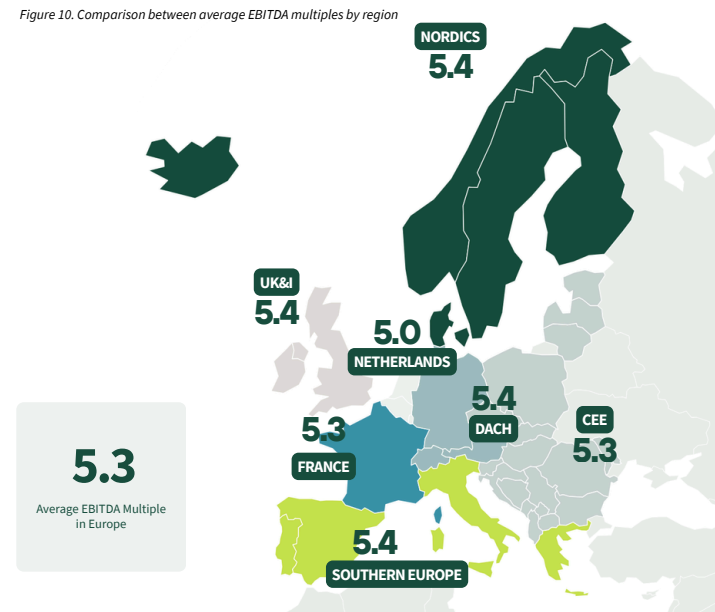
Regional differences in EBITDA multiples are narrowing. In H1-2026, four regions, DACH, UK&I, the Nordics, and Southern Europe, stand at 5.4, two regions (France, CEE) sit at 5.3, and the Netherlands at 5.0. The spread across all seven regions is just 0.4. This convergence goes hand in hand with growing transparency in market and deal data. Despite this regional convergence, sector-specific valuations continue to vary considerably by region, forming a strong incentive for cross-border M&A.
Seller expectations run high in over half of processes
Previous Dealsuite research identified unrealistic seller valuation expectations as a leading cause of terminated deals in the Nordic market. This edition asked advisors directly how often they encounter this gap between seller expectations and realistic market value, how large it typically is, and how often it ultimately breaks a deal.
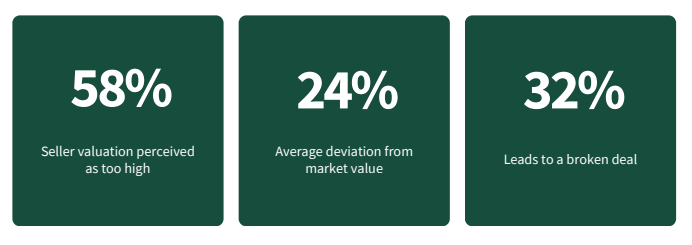
In 58% of transaction processes, advisors report that the seller's value perception is too high. In these cases, the deviation between the seller's expectation and the realistic market value typically amounts to 24%. In 32% of these cases, the valuation gap ultimately leads to the deal being broken off, meaning that in roughly two out of three cases where a gap exists, it is successfully bridged during the process.
Buyer interest remains strong
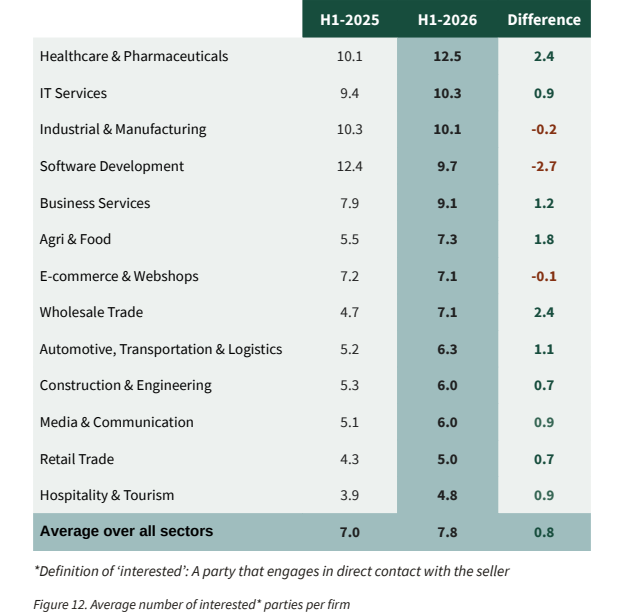
The average number of interested parties per listed company is a useful indicator of buyer appetite and competitive tension in a sale process. The average number of interested parties per firm rose to 7.8 in H1-2026, up from 7.0 in H1-2025, with most sectors seeing an increase in buyer interest. Healthcare & Pharmaceuticals recorded the highest buyer interest, up to 12.5 parties per firm, while Software Development was the exception, falling from 12.4 to 9.7, the largest decline of any sector.
Sentiment holds firm heading into H2-2026
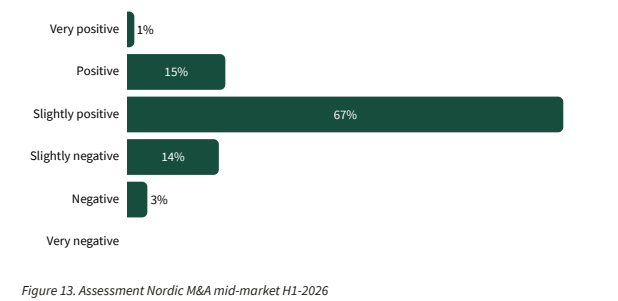
Assessing the performance of the Nordic M&A mid-market is based on many factors, including the willingness of entrepreneurs to sell their businesses, funding availability, and macroeconomic developments. Advisors were asked to assess the M&A mid-market in H1-2026. 83% of advisors held a positive view of H1-2026, in line with the 85% recorded for H2-2025.
Confidence carries into H2-2026
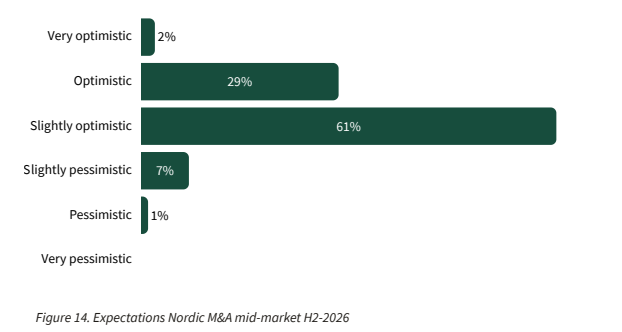
Looking ahead, advisors were asked what they expect from the second half of 2026, taking into account the same underlying drivers, seller appetite, financing conditions, and the wider economic backdrop. 92% of advisors are optimistic about H2-2026, roughly in line with the 88% recorded for H1-2026 in the last edition. Confidence in the Nordic mid-market has settled at a high level rather than swinging from one half-year to the next.
The majority of M&A transactions take place in the mid-market. This M&A Monitor uses the definition of a mid-market company as having a revenue between €1 million and €200 million. The survey that formed the basis for this M&A Monitor was sent to 295 M&A advisory firms. Considering their combined input, they represent an essential part of the M&A mid-market in the Nordics. Out of the total of 295 advisory firms, we received 95 responses (32% response rate).
Sources used:
• A total of 95 M&A advisory firms provided detailed input based on the transactions they advised on in H1-2026.
• Dealsuite deal database (2026)
• Dealsuite M&A Monitor research Q1-2015 t/m H2-2025
• Dealsuite. (2026). M&A mid-market trends report 2026.
• Dealsuite. (2025). European Deal Terms Report.
• Bain & Company. (2023, March 28). How companies got so good at M&A.
• Damodaran (2011). Equity Risk Premiums (ERP).
• Grabowski and Pratt (2013). Cost of Capital: Applications and Examples.
• Harding, D., & Rovit, S. (2004). Mastering the merger: Four critical decisions that make or break the deal. Harvard Business Press.
This research was conducted by Jelle Stuij and Roos Bijvoet. For further questions about this research, please contact Jelle Stuij.
For further information about Dealsuite, please contact Nick Jurgens.


.png)


Grow your network. Find more deals.
Science Park 106
1098 XG Amsterdam
Netherlands
© 2026 Dealsuite. All rights reserved.



.png)
.png)