|

Jelle Stuij
Thank you for taking the time to read this second edition of the Nordic M&A Monitor. This report consolidates research performed by Dealsuite, the leading Nordic and international platform for M&A transactions. It contains statistics and trends for the Nordic M&A mid-market (enterprises with a revenue between € 1 million and € 200 million) over the first half of 2025.
Dealsuite contacted 294 M&A advisory firms operating within the Nordic M&A mid-market.
The aim of this study is to create periodic insights that improve the Nordic market’s transparency and to serve as a benchmark for M&A professionals. We are convinced that sharing information within our network leads to an improved quality and volume of deals.
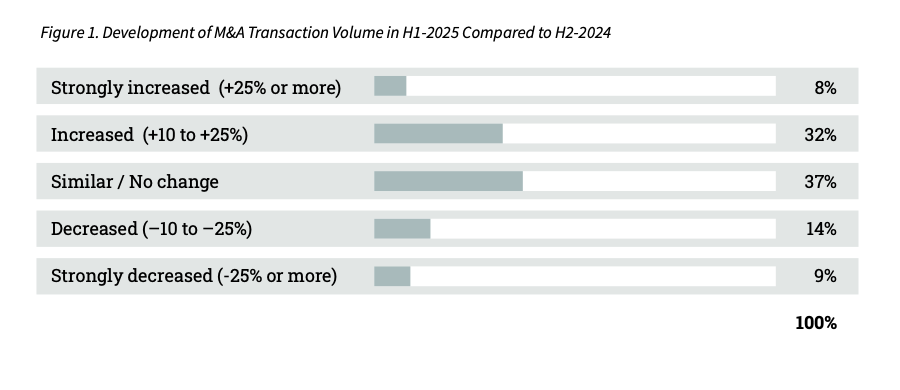
After years of turbulence, uncertainty has become less of an exception, and more of a constant. Since 2020, the M&A market has been confronted with a series of external influences: high inflation, rapidly rising interest rates, geopolitical tensions both inside and outside of Europe, and global trade wars putting pressure on economic dynamics. Where these factors previously led to hesitation among buyers and sellers, there now appears to be a structural adjustment. Many dealmakers have adapted to this new reality, where volatility is more often the rule than the exception. This adaptation marks the emergence of a ‘new normal’ that is visible across the M&A market, particularly in the SME segment, which has traditionally also been less susceptible to macroeconomic fluctuations.
Even now, the SME segment is showing a relatively stable picture, despite ongoing external uncertainties. This translates into a market that appears more resilient than before.
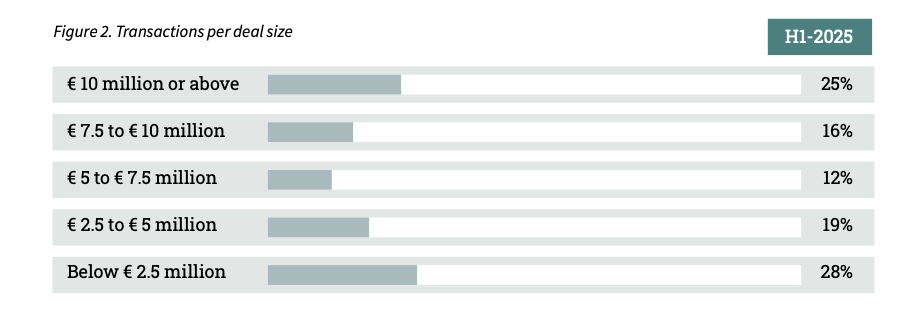
In H1-2025, nearly half of all transactions in the Nordics were valued below €5 million, with the smallest deals under €2.5 million alone making up 28% of the market. At the upper end, a quarter of transactions had a value above €10 million. The middle ranges together accounted for just over one quarter of the market, with 12% in the €5–7.5 million bracket and 16% in the €7.5–10 million bracket.
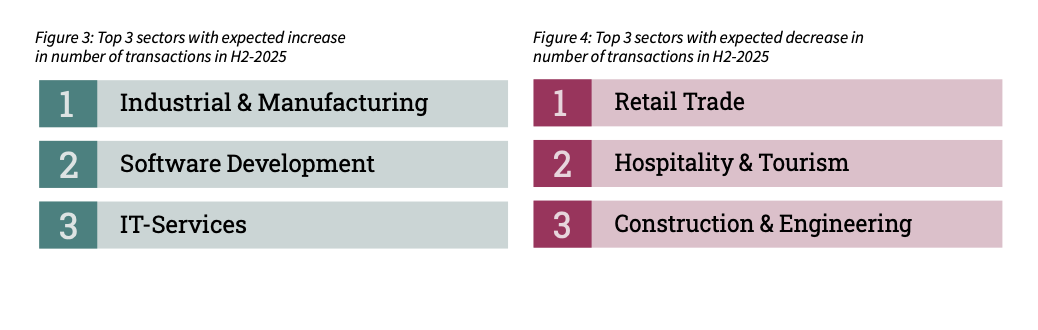
The number of expected transactions in a sector is influenced by a variety of market, industry, and financing-related factors. To gain insight into anticipated shifts, advisors were asked in which sector they expect the largest increase or decrease in the number of transactions in H2-2025. Each respondent could indicate one sector. The results are presented in two charts, showing the three sectors most frequently mentioned for an expected increase and decrease.
Industrial & Manufacturing was most frequently cited as the sector expected to see the largest increase (32% of respondents), followed by Software Development (27%) and IT-services (17%).
Retail Trade was most frequently cited as the sector expected to see the largest decrease (29% of respondents), followed by Hospitality & Tourism (17%) and Construction & Engineering (13%).
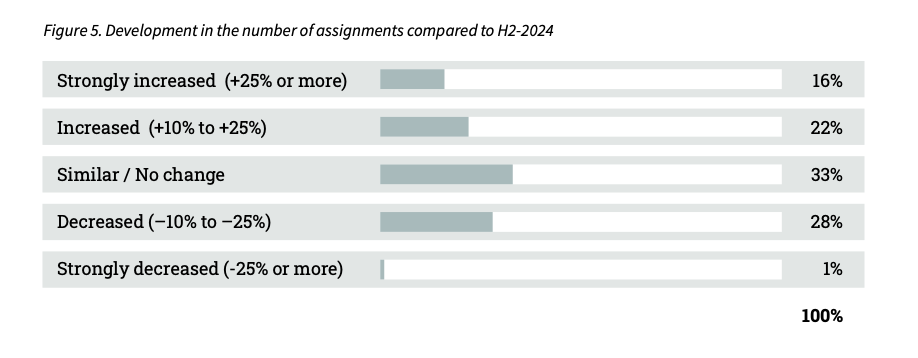
The results are explained in more detail in Figure 5 below. These are assignments received in H1-2025 and completed in H1-2025, however, it is worth noting that some of these projects may be completed during a later period or canceled.
In H1-2025, 33% of advisors reported a similar number of transactions compared to H2-2024. While 29% of advisors noticed a drop, 38% reported an increase in the number of assignments.
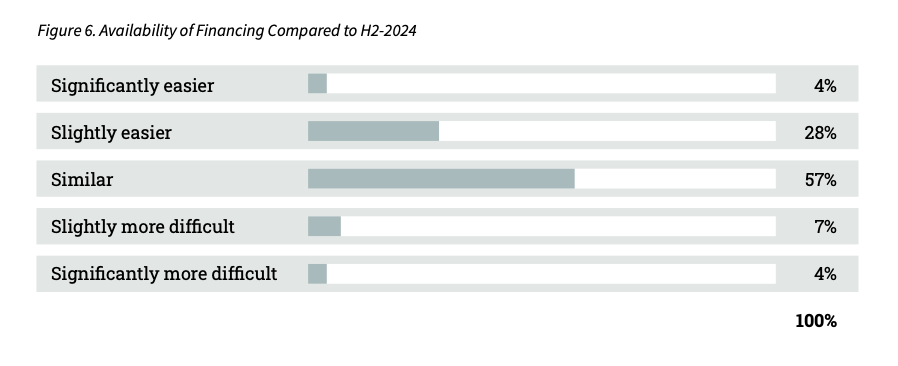
Advisors were asked to report on the availability of financing compared to H2-2024, the results are shown in Figures 6 and 7. In the Nordics, access to financing has been reported as largely unchanged or somewhat easier than in the previous half year. 57% of respondents stated that conditions remained the same in H1-2025, 32% observed an improvement, while 11% reported more difficult financing conditions.
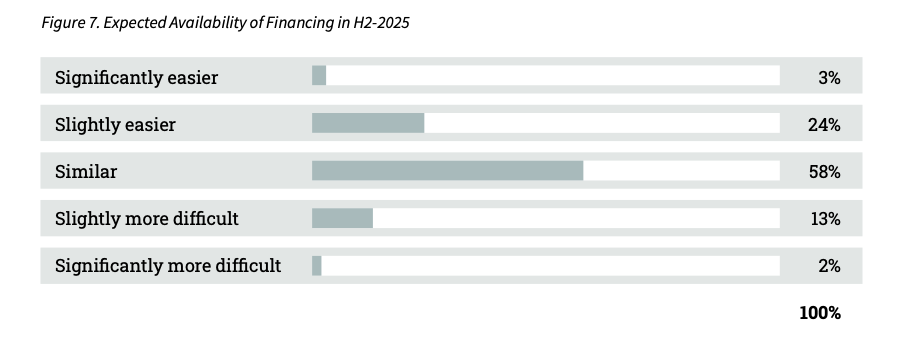
Looking ahead to the second half of 2025, expectations regarding financing conditions in the Nordics are generally positive. A majority of respondents (58%) expect conditions to remain unchanged, while 24% anticipate that financing will become slightly easier and 3% even foresee a significant improvement. By contrast, 13% expect financing to be slightly more difficult, and only 2% predict it will become significantly harder.
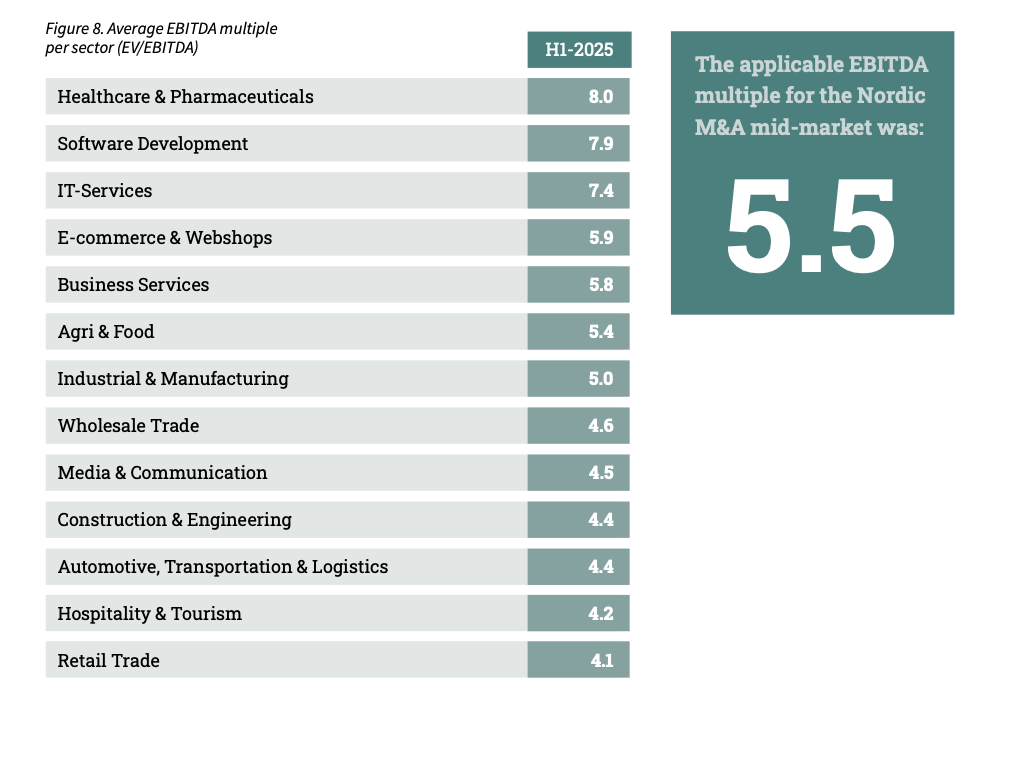
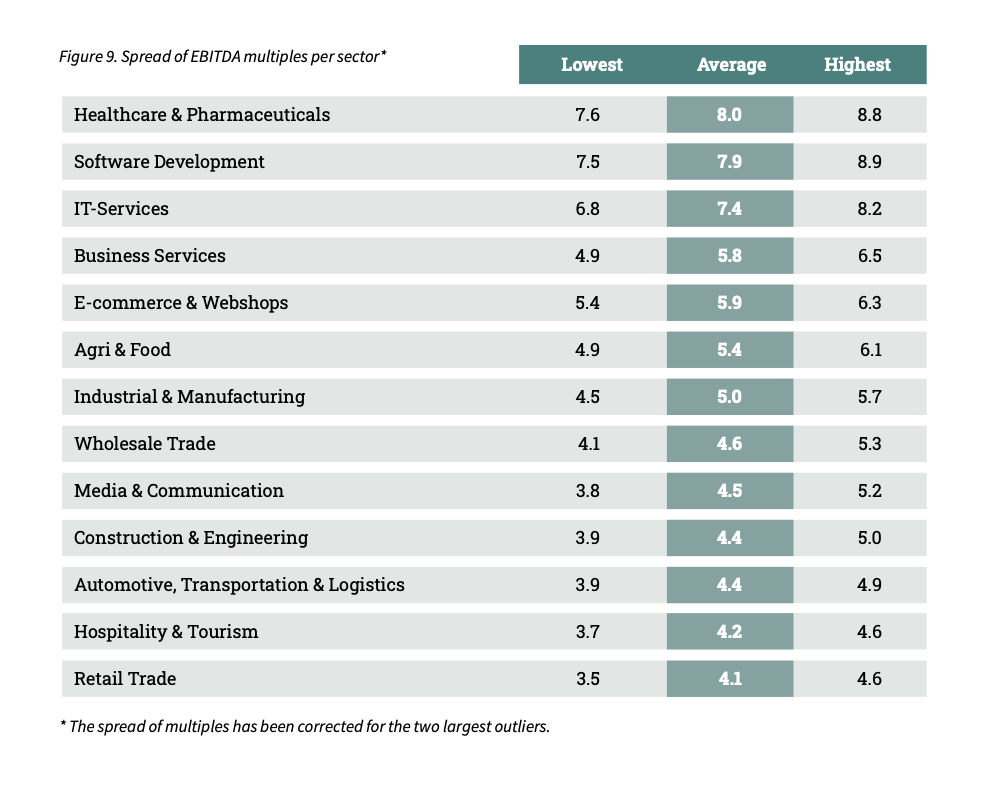
The average EBITDA-multiple in the Nordics is 5.5 and varies by sector. It ranges from 4.1 (Retail Trade) to 8.0 (Healthcare & Pharmaceuticals), which means that the purchase price differs by up to 95% depending on the sector of the company. The results of this study provide a starting point for the applicable sector-multiples. They therefore offer a good benchmark for cross-checking company valuations in the near future.
Company valuations are inherently specific and depend on factors such as growth, profitability, market position, and risk. While a multiple alone is not a complete valuation method, it provides a useful benchmark, particularly for comparing similar transactions in the near term.
Figure 9 illustrates the distribution of EBITDA multiples by sector. Some sectors encompass a wide range of companies, which explains the broader spreads compared with sectors composed of more similar businesses. The table shows the typical range of EBITDA multiples per sector, though individual transactions can occur at significantly higher or lower levels.
To provide a representative view of a typical company within each sector, the range has been adjusted to exclude the two largest outliers per sector.
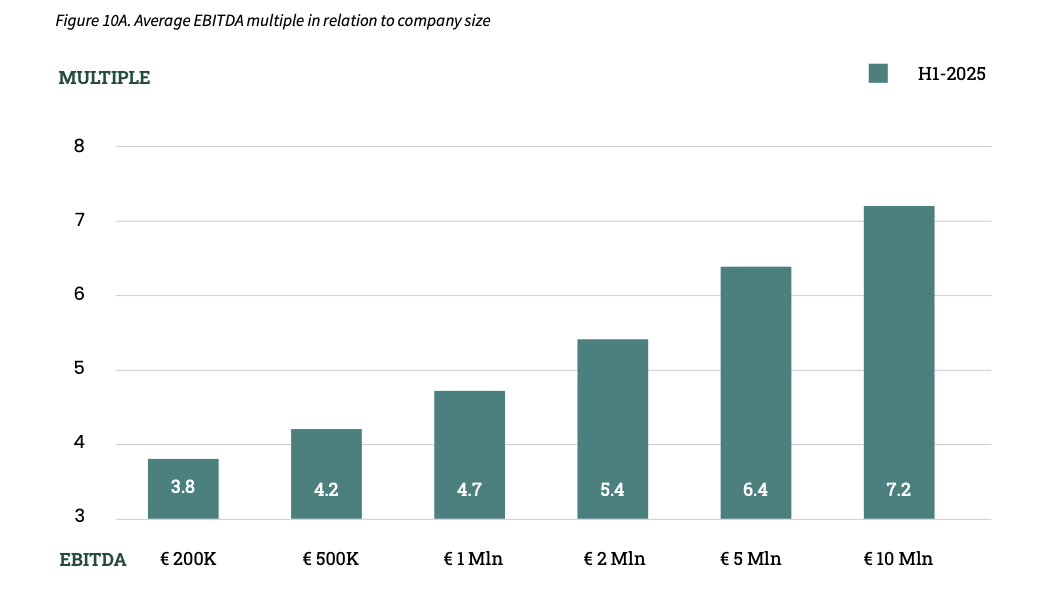
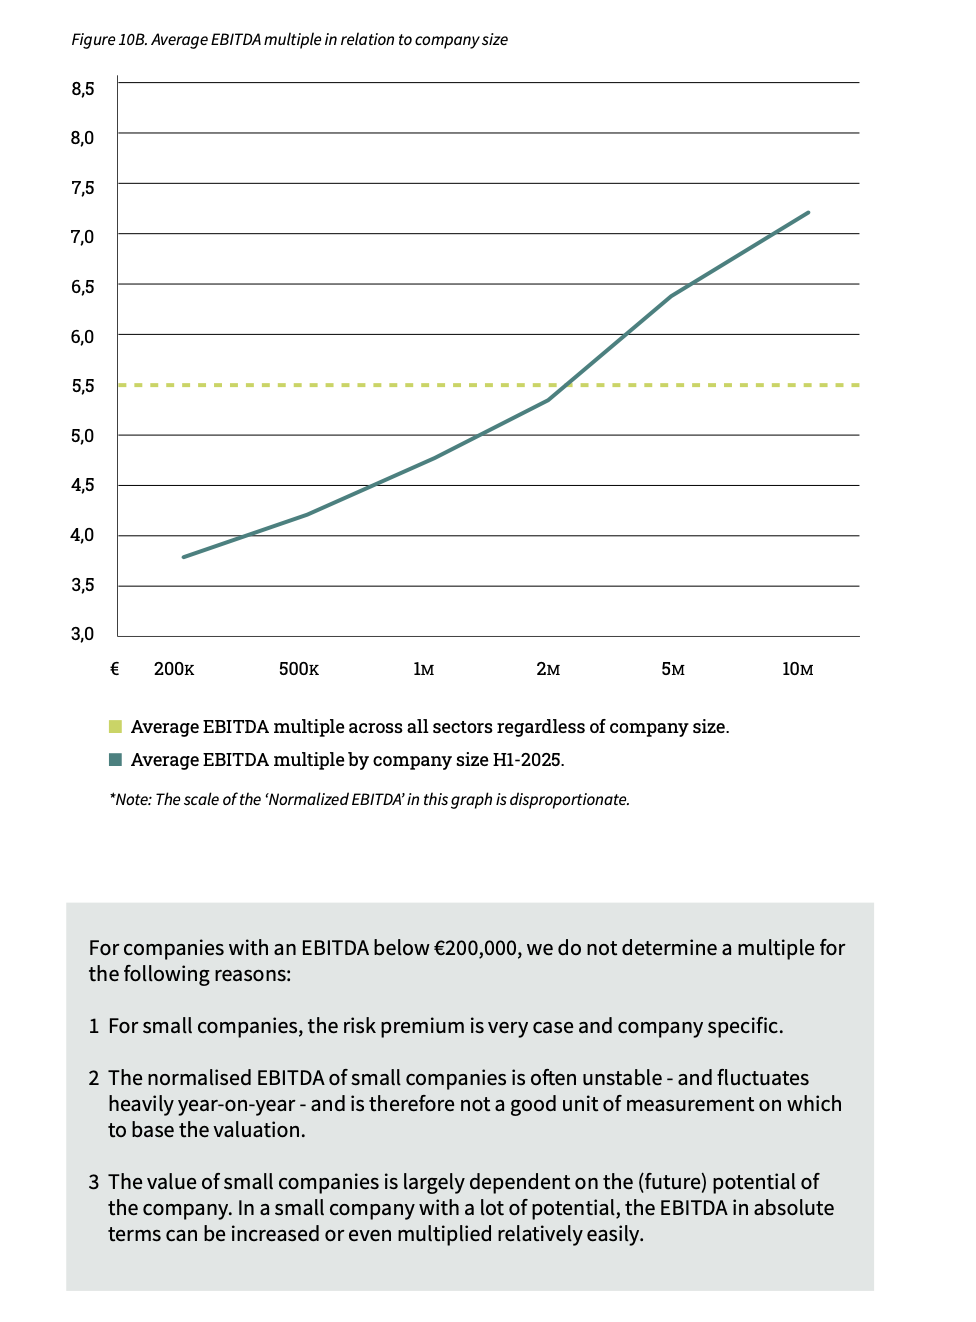
The size of a company plays a crucial role in determining multiples in business valuation. For small and medium-sized enterprises (SMEs) in the Nordics, it is essential to accurately quantify the impact of the Small Firm Premium. This is particularly relevant for businesses with an EBITDA ranging from €200,000 to €10,000,000.
Studies have shown that smaller companies face a higher likelihood of not achieving their expected cash flows (Damodaran, 2011; Grabowski and Pratt, 2013). This can be attributed to factors such as reliance on specific customers or suppliers, or dependence on unique technical expertise that may be lost if key employees leave. Such vulnerabilities can significantly impact a company’s returns and, consequently, its valuation. The elevated risk premium associated with smaller businesses, known as the Small Firm Premium, leads to a reduction in value. As a result, EBITDA multiples for larger companies tend to be higher on average compared to those for smaller companies.
The results of this monitor survey confirm again that companies with a low EBITDA have a lower multiple than companies with a high EBITDA. The influence of company size on EBITDA multiples paid is presented in Figures 10A and 10B. The difference in the EBITDA multiple between companies with a normalised EBITDA of €200,000 and €10,000,000 is 3.4 (3.8 compared to 7.2).
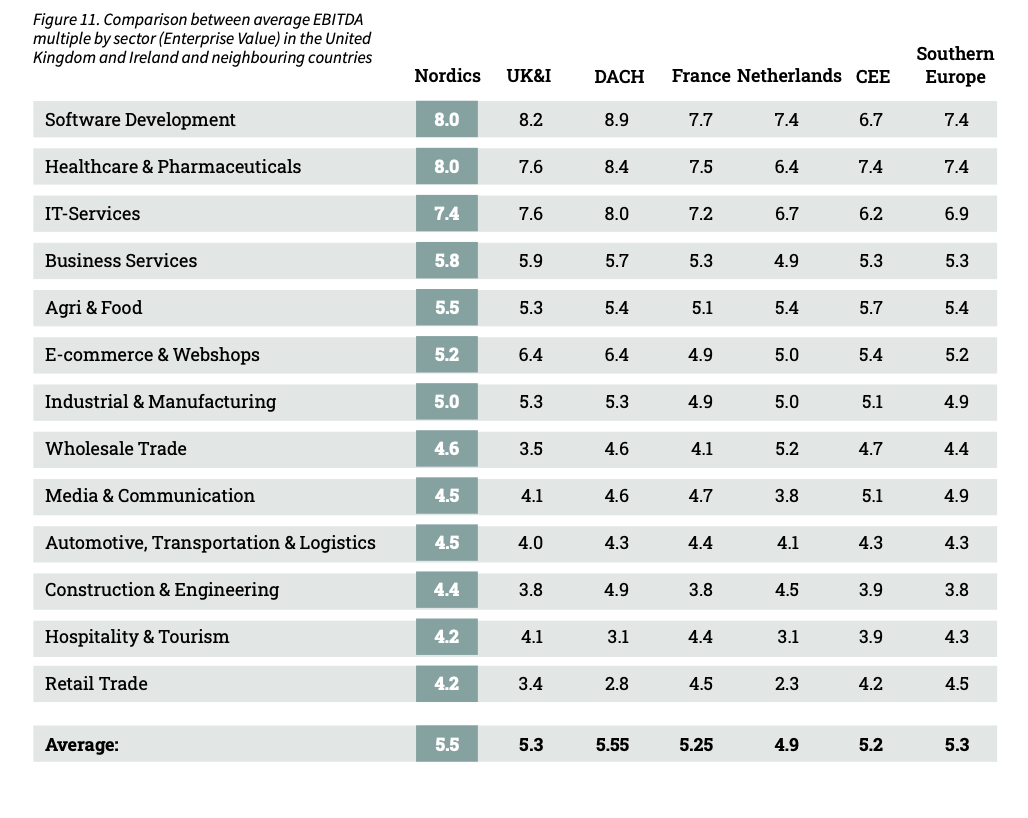
A comparison of EBITDA multiples between different countries highlights the advantages of cross-border deals. For example, it can be beneficial to buy a particular company abroad or to sell a company to an international buyer. Figure 11 shows the differences in EBITDA multiples between European markets.
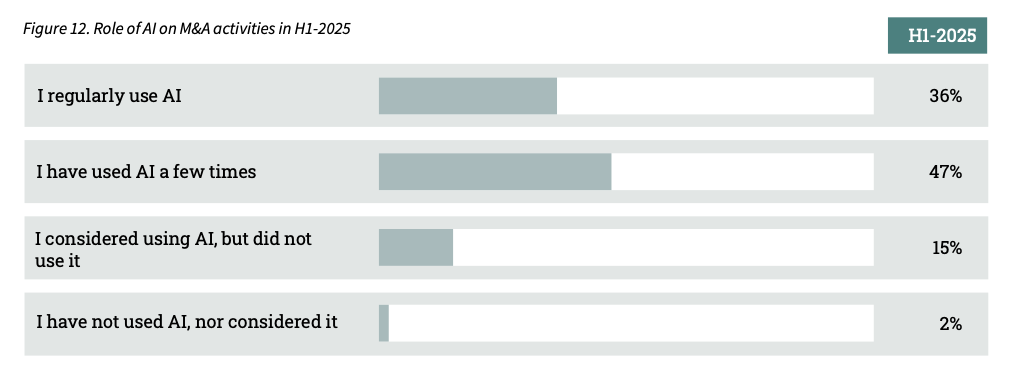
In the first half of 2025, AI has become a widely adopted tool in M&A activities across the Nordics. Over one-third of respondents (36%) report using AI on a regular basis, while nearly half (47%) have experimented with it a few times. A smaller group (15%) have considered AI but not yet applied it, and only 2% have not engaged with it at all, underscoring that AI is now firmly embedded in the regional M&A landscape.
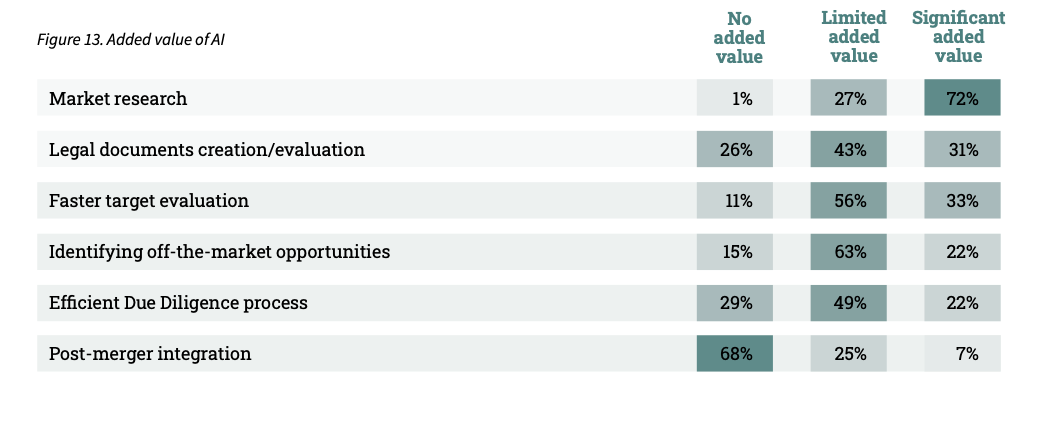
In H1-2025, AI is perceived as adding the most value in market research, with 72% of respondents reporting significant benefits and almost no one seeing no value at all. More than half of advisors also noted at least some added value in identifying off-market opportunities and in faster target evaluation, though fewer rated the impact as significant. In due diligence and legal document review, the role of AI is seen as more limited, with only around one in five advisors highlighting strong value. Post-merger integration stands out as the area where AI is least impactful, as more than two-thirds of respondents reported no added value.
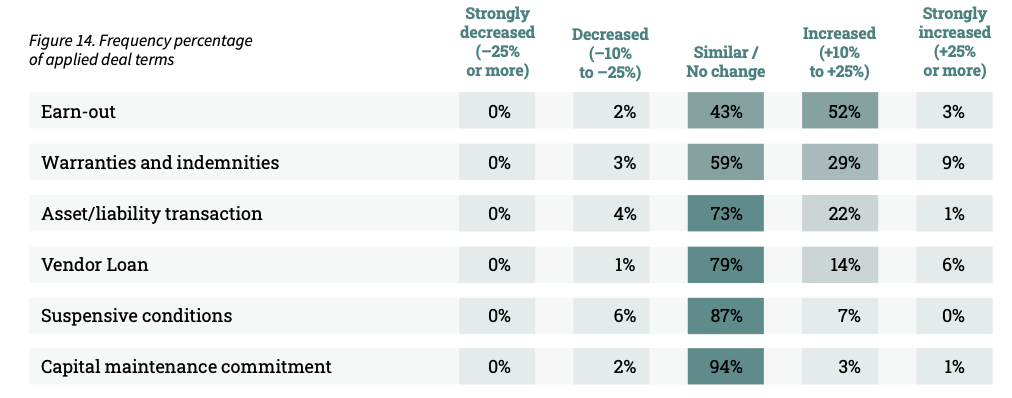
Macroeconomic developments can influence the use of specific deal terms. In this edition of the M&A Monitor, the application and frequency of various deal terms were analyzed (Figure 14).
In H1-2025, the use of most common deal terms in the Nordics remained broadly stable compared with H2-2024. Earn-outs were the strongest mover, with 55% of respondents reporting increased application. Warranties and indemnities also gained traction, as 38% observed higher usage. Asset/liability transactions showed a modest upward trend, with 23% noting an increase.
By contrast, vendor loans remained largely steady, with 79% reporting no change and only a minority indicating an increase. Capital maintenance commitments were almost entirely stable, with 94% of respondents seeing no change. Similarly, suspensive conditions showed little movement, with 87% reporting stability and just 7% noting an increase.
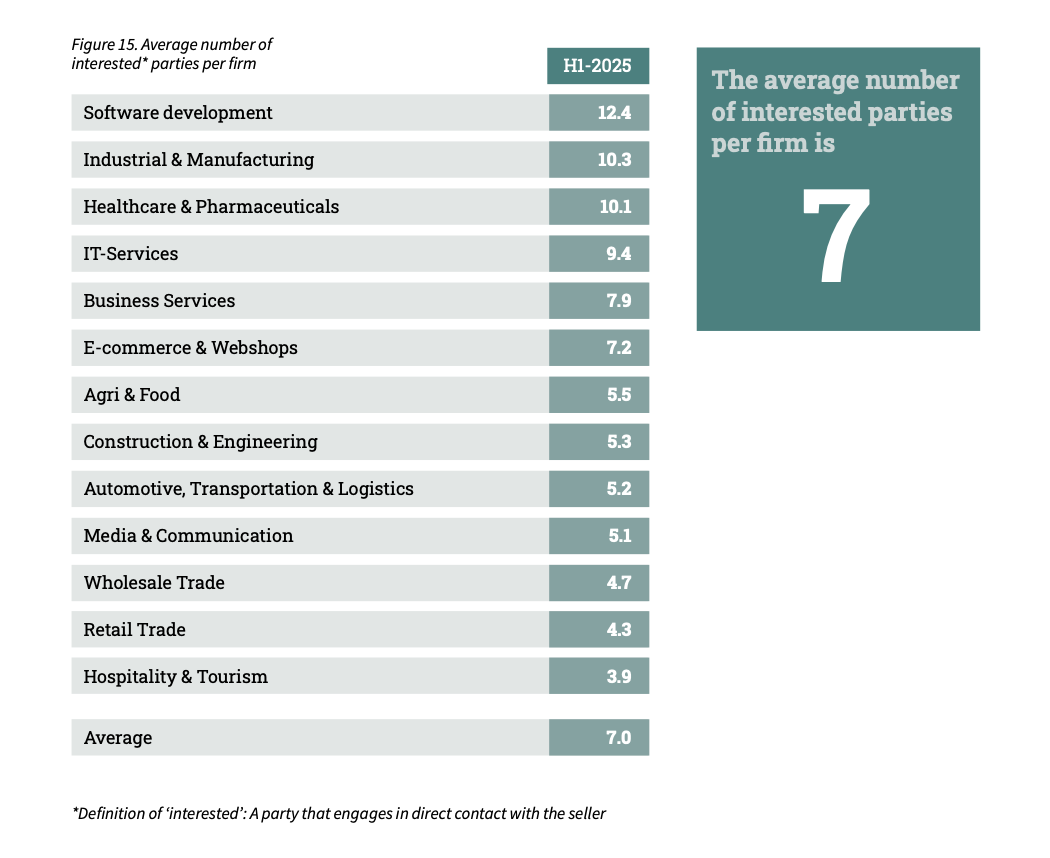
The M&A market is a ‘sellers market’. The balance between supply and demand in the M&A market varies by sector. M&A advisory firms were asked to indicate, for each sector, how many serious potential buyers typically show interest in a company that is put up for sale. The results are presented in Figure 15.
Various factors can influence the number of interested buyers. This is affected, among other things, by financing conditions, economic uncertainty, or sector developments that impact buyer appetite. In H1-2025, the number of average interested parties per offered firm is 7.
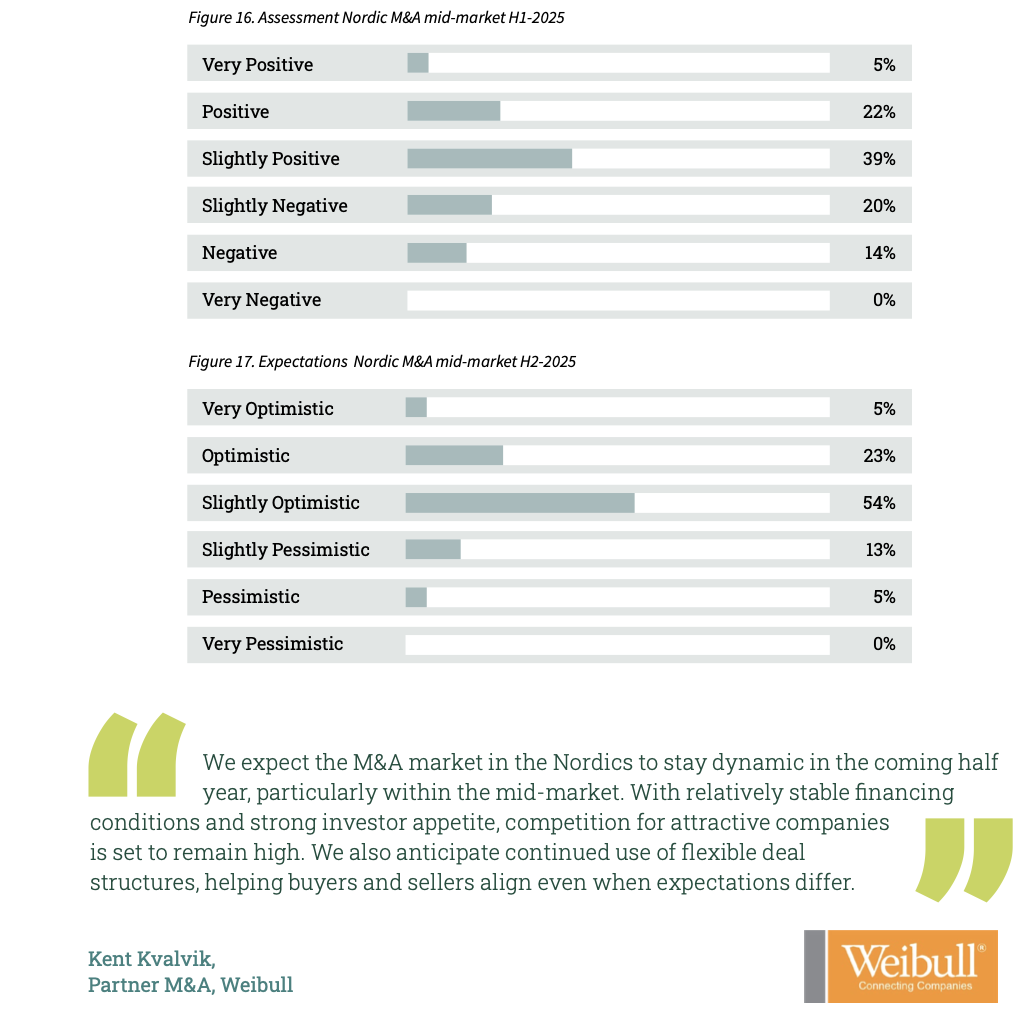
Assessing the performance of the Nordic M&A mid-market is based on many factors, including the willingness of entrepreneurs to sell their businesses, funding availability, macroeconomic developments, etc. An interpretation of these factors is needed to determine how the market will develop. The survey included both assessments of the M&A mid-market in H1-2025 (retrospective) and H2-2025 (projection).
Looking back at the first half of 2025, the majority of advisors are satisfied with the performance. 66% of advisors report a positive feeling about the performance of H1-2025, while 34% of respondents held a rather negative view. Looking ahead, 82% of advisors have positive expectations for H2-2025.
The majority of M&A transactions occur within the mid-market segment. For the purposes of this M&A report, mid-market companies are defined as those with revenues between €1 million and €200 million. The underlying survey for this report was distributed to 294 M&A advisory firms, considering their combined input, they represent an essential part of the M&A mid-market. Out of the total of 294 advisory firms, we received responses from 112 M&A advisory firms.
Sources used:
• 112 survey responses from M&A advisory firms in the Nordic region
• Bain & Company. (2023, March 28). How companies got so good at M&A.
• Dealsuite. (2025). M&A mid-market trends report 2025.
• Dealsuite M&A Monitors 2015 - 2025
• Dealsuite transaction data 2015-2025
• Field, A. (2011) Discovering Statistics SPSS. Third edition, SAGE publications, London. 1 -822
• Grabowski and Pratt (2013). Cost of Capital: Applications and Examples.
This research was conducted by Jelle Stuij and Roos Bijvoet. For further questions, please contact Jelle Stuij. To discover how Dealsuite can benefit your business - contact Lars Brouwer, Teamlead Nordics.

.png)


Grow your network. Find more deals.
Science Park 106
1098 XG Amsterdam
Netherlands
© 2026 Dealsuite. All rights reserved.


.png)