Research papers
|

Jelle Stuij
Thank you for your interest in the second edition of the M&A Monitor for Southern Europe by Dealsuite. This report consolidates research performed by Dealsuite, the leading tool for M&A transactions. It contains statistics and trends for the Southern European M&A mid-market (enterprises with a revenue between €1 million and €200 million) across Spain, Italy, Greece, and Portugal over the second half of 2025.
The aim of this study is to create periodic insights that improve the Southern European market’s transparency and to serve as a benchmark for M&A professionals. We are convinced that sharing information within our network leads to an improved quality and volume of deals.

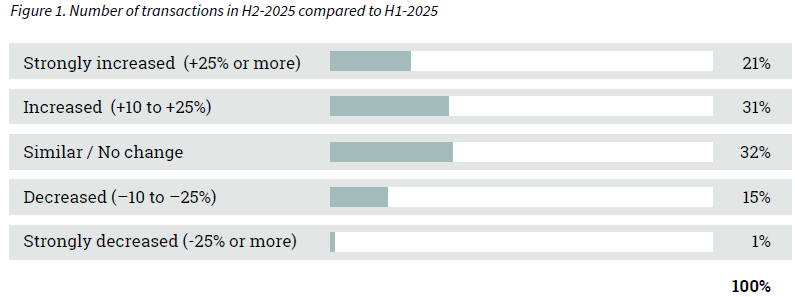
Increased number of transactions in H2-2025
After years of volatility, uncertainty is the new normal in the M&A market. Dealmakers, particularly in the SME segment, are proving resilient and well-adapted to this structural change. To safeguard transaction progress in an unpredictable market environment, dealmakers are increasingly applying flexible deal structures. According to the Dealsuite M&A Deal Terms Report, there is a clear increase in the use of deferred payments and other forms of risk-sharing. In the first half of 2025, transaction volume increased compared to the end of 2024. In the second half of 2025, 52% of advisors again reported an increase in the number of transactions.
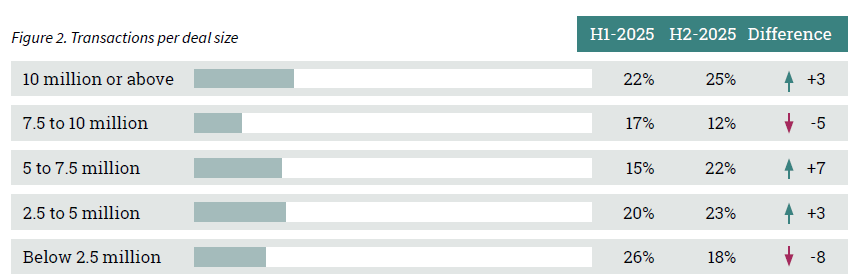
Clear increase in the share of transactions above €2.5 million
In the second half of 2025, the deal mix shifted toward mid-sized and larger transactions compared to the first half of the year. The share of deals above €10 million increased from 22% to 25% (+3 percentage points). The €5–€7.5 million segment saw the most significant rise, climbing from 15% to 22% (+7 percentage points). At the same time, smaller transactions declined. The share of deals below €2.5 million decreased from 26% to 18% (–8 percentage points).
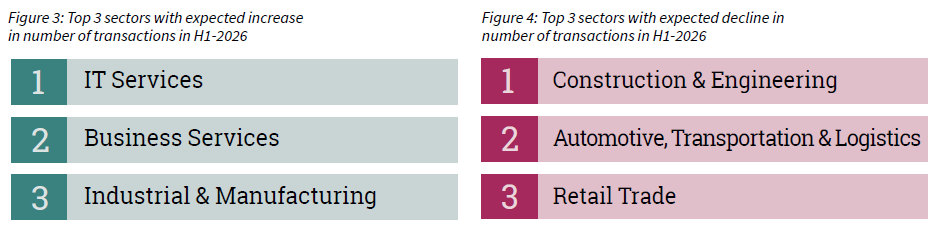
IT Services is expected to drive transaction growth in H1-2026
To assess expected market developments, M&A advisors were asked which sectors they anticipate to have the largest increases or decreases in deal activity during the first half of 2026. Each respondent selected one sector. The results are presented in two charts, highlighting the three sectors most frequently cited for expected increases and decreases in transaction volumes.
When asked which sector is expected to see the largest increase in transaction volume, M&A advisors reaffirmed their H1-2025 views: IT Services, Business Services, and Industrial & Manufacturing remain the three sectors with an expected increase in deal flow.
Expectations regarding declining transaction activity remain concentrated in a limited number of sectors. Advisors identified Construction & Engineering as the sector likely to see the largest decrease in deal volume in H1-2026, followed by Automotive, Transportation & Logistics and Retail Trade.
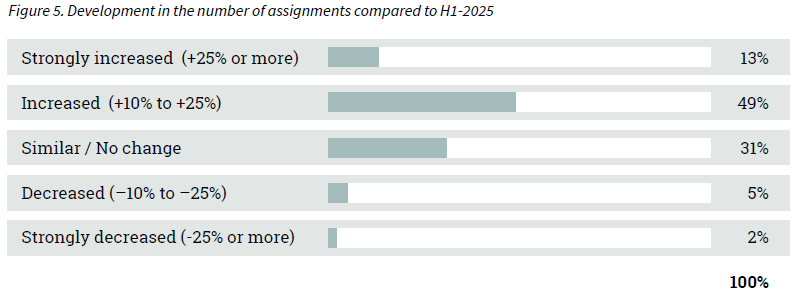
Substantial increase in the expected number of M&A transactions
An increase or decrease in assignments at advisory firms provides insight into expected deal flow and market sentiment. The results are shown in Figure 5 below. These are assignments received in the second half of 2025 and (partly) converted into transactions during the same period. In some cases, these assignments will not lead to a deal until H1-2026, or will still be terminated.
In H2-2025, 31% of advisors reported no change in the number of transactions compared to H1-2025. Meanwhile, 7% observed a decline, while a significant share (62%) reported an increase in the number of assignments.
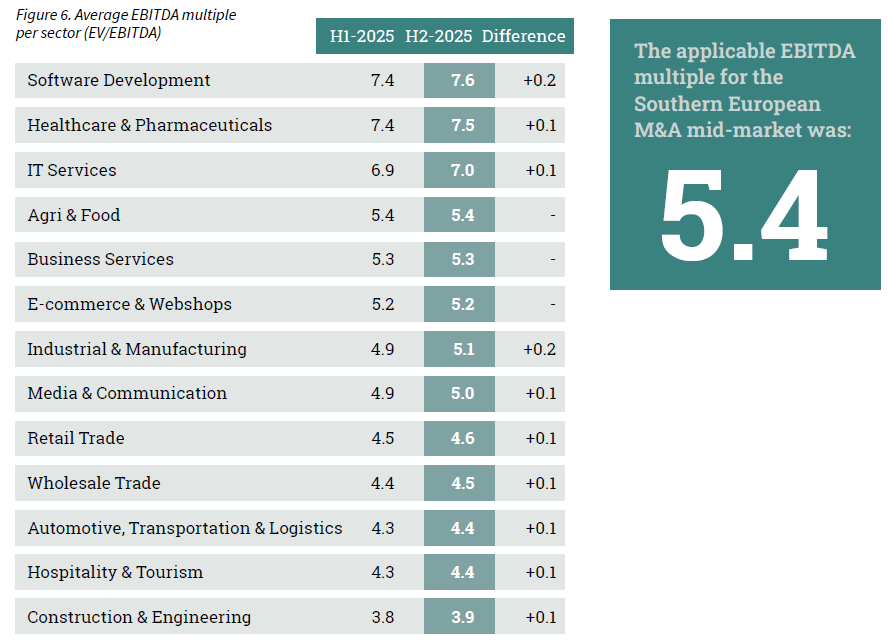
The average EBITDA multiple increased to 5.4
EBITDA multiples serve as a widely accepted benchmark for business valuation, offering insight into what buyers are prepared to pay across different sectors. Since early 2015, Dealsuite has published semi-annual updates on average sector multiples, reflecting the typical EBITDA multiple paid for companies within each industry.
For this study, respondents provided their current observations of transaction multiples, informed by their adjusted market insights. These findings, shown in Figure 6, represent multiples based on the enterprise value (EV) of the acquired companies.
The average EBITDA multiple increased in H2-2025, rising from 5.3 to 5.4. Most sector multiples moved in line with the overall upward trend, while some remained stable. Software Development and Industrial & Manufacturing recorded the largest increases, both rising by 0.2.
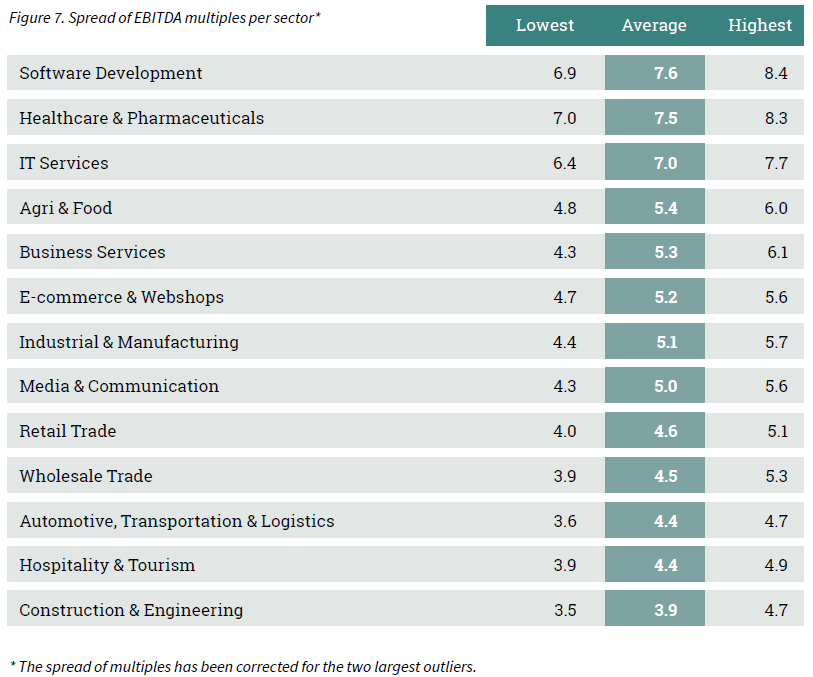
Biggest spread reported in the Business Services sector
A business valuation is inherently company-specific and depends on a wide range of factors, including growth prospects, profitability, market position, and risk profile. A multiple, on its own, does not constitute a complete valuation methodology, but it serves as a useful cross-check, particularly when assessing comparable transactions in the near term.
Figure 7 illustrates the distribution of EBITDA multiples by sector. Some sectors encompass a wide range of companies, which explains the broader spreads compared with sectors composed of more similar businesses. The table shows the typical range of EBITDA multiples per sector, though individual transactions can occur at significantly higher or lower levels.
To provide a representative view of a typical company within each sector, the range has been adjusted to exclude the two largest outliers per sector.
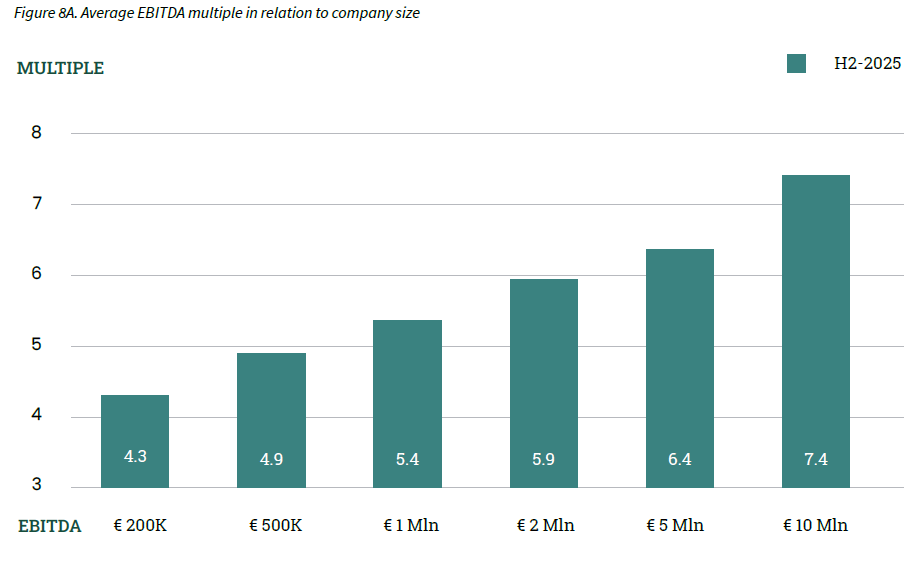
A difference remains between multiples for large and small companies
The size of a company plays a crucial role in determining multiples in business valuation. For small and medium-sized enterprises (SMEs) in Southern Europe, it is essential to accurately quantify the impact of the Small Firm Premium. This is particularly relevant for businesses with an EBITDA ranging from €200,000 to €10,000,000.
Studies have shown that smaller companies face a higher likelihood of not achieving their expected cash flows (Damodaran, 2011; Grabowski and Pratt, 2013). This can be attributed to factors such as reliance on specific customers or suppliers, or dependence on unique technical expertise that may be lost if key employees leave. Such vulnerabilities can significantly impact a company’s returns and, consequently, its valuation. The elevated risk premium associated with smaller businesses, known as the Small Firm Premium, leads to a reduction in value. As a result, EBITDA multiples for larger companies tend to be higher on average compared to those for smaller companies.
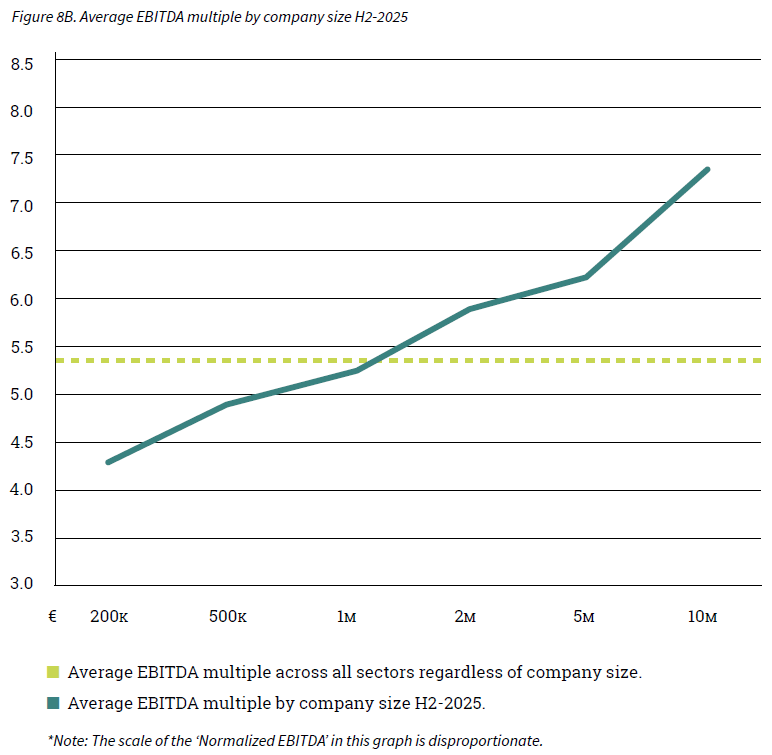
The results of this monitor survey confirm again that companies with a low EBITDA have a lower multiple than companies with a high EBITDA. The influence of company size on EBITDA multiples paid is presented in Figures 8A and 8B.
The difference in the EBITDA multiple between companies with a normalised EBITDA of €200,000 and €10,000,000 is 3.1 (4.3 compared to 7.4).
For companies with an EBITDA below €200.000, we do not determine a multiple for the following reasons:
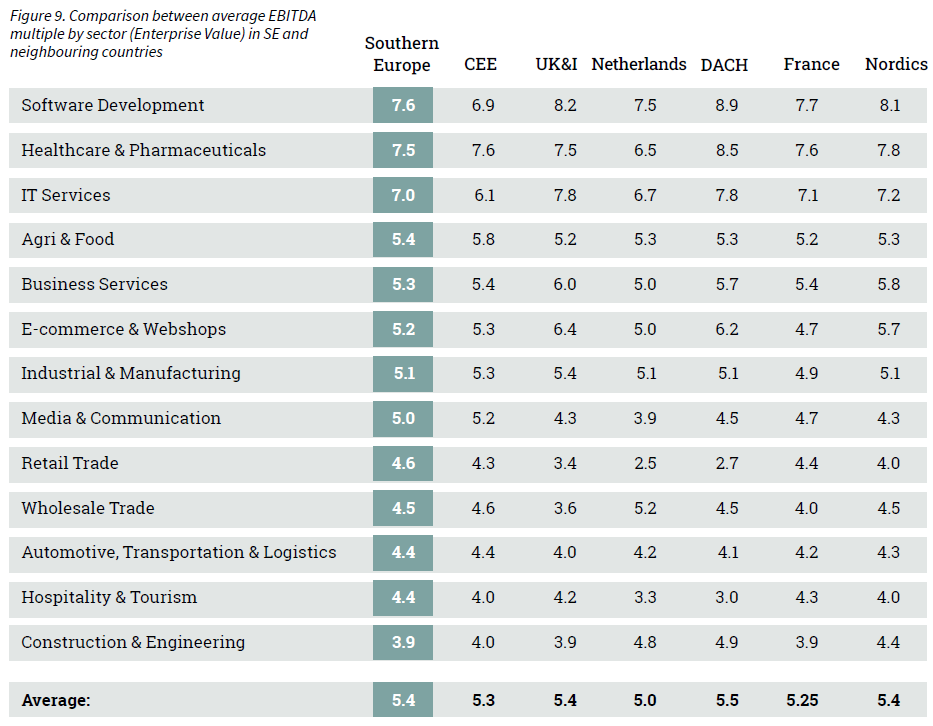
A comparison of EBITDA multiples between different countries highlights the advantages of cross-border deals. For example, it can be beneficial to buy a particular company abroad or to sell a company to an international buyer. Figure 9 shows the differences in EBITDA multiples between European markets.
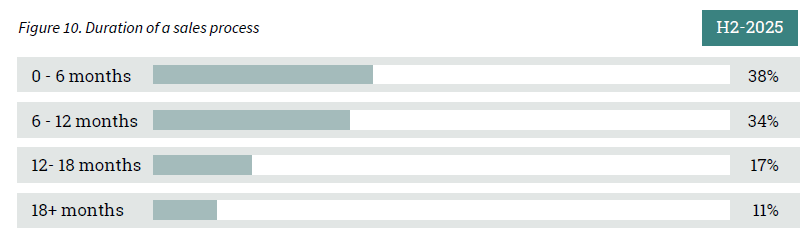
28% of sales processes have a duration of over a year
The duration of a sale process is influenced by factors such as market complexity, the seller’s level of preparation, and financing pressure on buyers. The lead time of a transaction, from mandate acquisition to deal closing, can vary significantly.
The lead times of sale processes are distributed on a percentage basis across the categories shown in Figure 10. The majority (72%) of sales processes guided by an M&A advisor had a duration of less than 12 months. 28% of sales processes have a duration of over a year.

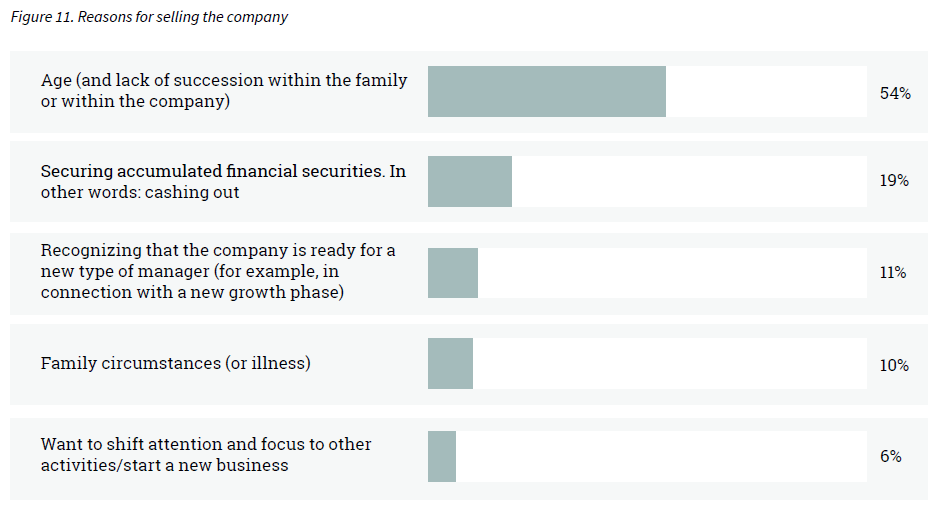
Age is the most common reason for selling a business
A company sale can be initiated for a wide range of reasons. In some cases, age plays a role and there is no suitable succession, while in others the objective is to secure the financial value built up over time. In different situations, there may be a need for a new type of management to guide the company into its next phase of growth. In short, the underlying rationale varies by entrepreneur and circumstance.
M&A advisory firms were asked to identify the primary reasons for a company sale. The following reasons collectively total 100% and are presented in Figure 11.
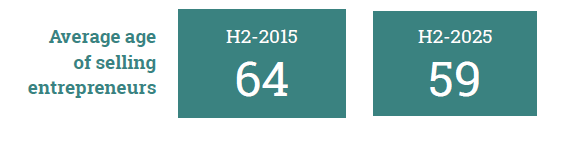
The average age of a selling entrepreneur has decreased
Age (and lack of succession within the family or within the company) remains the main reason for selling a business in over half of transactions (54%). The advisors were also asked about the average age of a selling entrepreneur, and what the average age was 10 years ago. Over the past ten years (2015-2025), the average age has decreased from 64 to 59.

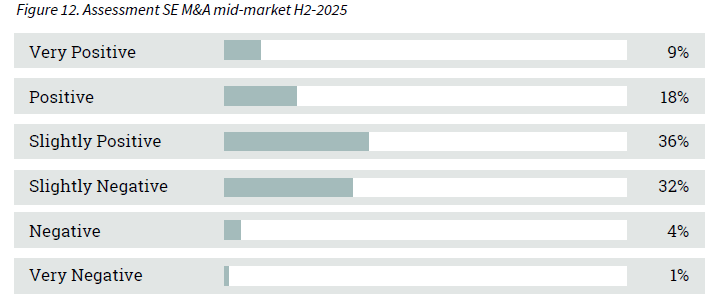
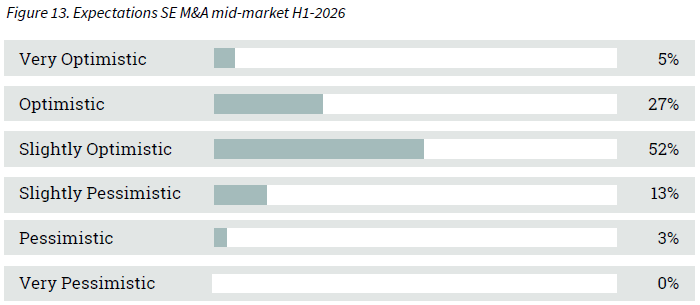
Positive assessment of H2-2025 and optimism for H1-2026
Assessing the performance and outlook of the SE M&A mid-market is influenced by a range of factors, including seller willingness, access to financing, valuation expectations, and broader macroeconomic conditions. To capture both current sentiment and forward-looking expectations, M&A advisors were asked to assess the market in H2-2025 (retrospective) and provide their expectations for H1-2026 (projection).
Looking back at H2-2025, 63% of advisors viewed the market positively, while the remaining 37% expressed some level of negative sentiment, most of which was slightly negative.
Looking ahead to H1-2026, 84% of advisors express optimism, indicating growing confidence in market conditions. Only 16% hold a more cautious outlook.
X Method
The majority of M&A transactions take place in the mid-market. This M&A Monitor uses the definition of a mid-market company as having a revenue between 1 and 50 million euros.
For this edition of the M&A Monitor, Dealsuite conducted a survey among M&A advisory firms active in the mid-market in Southern Europe. The survey was sent to 423 advisory firms, which collectively represent a significant share of the regional mid-market M&A landscape. In total, 121 firms provided detailed input, resulting in a 29% response rate.
The conclusions are further supported by Dealsuite’s proprietary data and ongoing market intelligence. Together, these inputs provide a comprehensive view of current market trends, activity levels, valuation developments, and sentiment across the Southern European mid-market M&A landscape.
This study is further supported by other regional Dealsuite M&A Monitors, analyzing the mid-market landscape in the CEE, DACH, UK&I, France, Southern Europe, the Nordics and the Netherlands.
Additional sources used:
This research was conducted by Jelle Stuij, and Roos Bijvoet. For further questions about the research, please contact Jelle Stuij. Want to know more about Dealsuite? Please contact Carla de Moel.


.png)


Grow your network. Find more deals.
Science Park 106
1098 XG Amsterdam
Netherlands
© 2026 Dealsuite. All rights reserved.


.png)