|

Jelle Stuij
Thank you for taking the time to read this sixth edition of the European M&A Monitor. This report consolidates research conducted by Dealsuite, the leading European platform for M&A transactions. It provides statistics and trends for the European M&A mid-market (enterprises with a revenue between €1 million and €200 million) over the first half of 2025.
For this research, 828 leading mid-market M&A advisory firms across Europe shared firsthand insights exclusively with Dealsuite, based on the transactions they completed in H1-2025. Their contributions, combined with proprietary Dealsuite data and reports, form the foundation of this study. Since many of these deals are not publicly disclosed, Dealsuite’s network provides unparalleled visibility into the otherwise opaque European mid-market.
The aim of this study is to create periodic insights that enhance the transparency of the European market and serve as a benchmark for M&A professionals. While we have been publishing local/regional reports for several years, this is the sixth time we publish this pan-European report, with a focus on inter- regional differences as well as similarities. We are convinced that sharing information within our network leads to an improved quality and volume of deals.
After several years of disruption, uncertainty has become a lasting feature of the European M&A landscape. Since 2020, deal activity across Europe has been shaped by a combination of external challenges: high inflation, rising interest rates, geopolitical tensions both within and outside Europe, and growing protectionism in global trade.
These factors previously led to hesitation among buyers and sellers. However, the first half of 2025 shows signs of a broader adjustment. The market seems to have adapted to a reality where volatility is the norm rather than the exception. This shift reflects a new ‘normal’ that can be seen in most markets, especially in the SME segment, which has traditionally been more resilient to economic swings.
Figure 1 shows the development of transactions over H1-2025 compared to H2-2024.
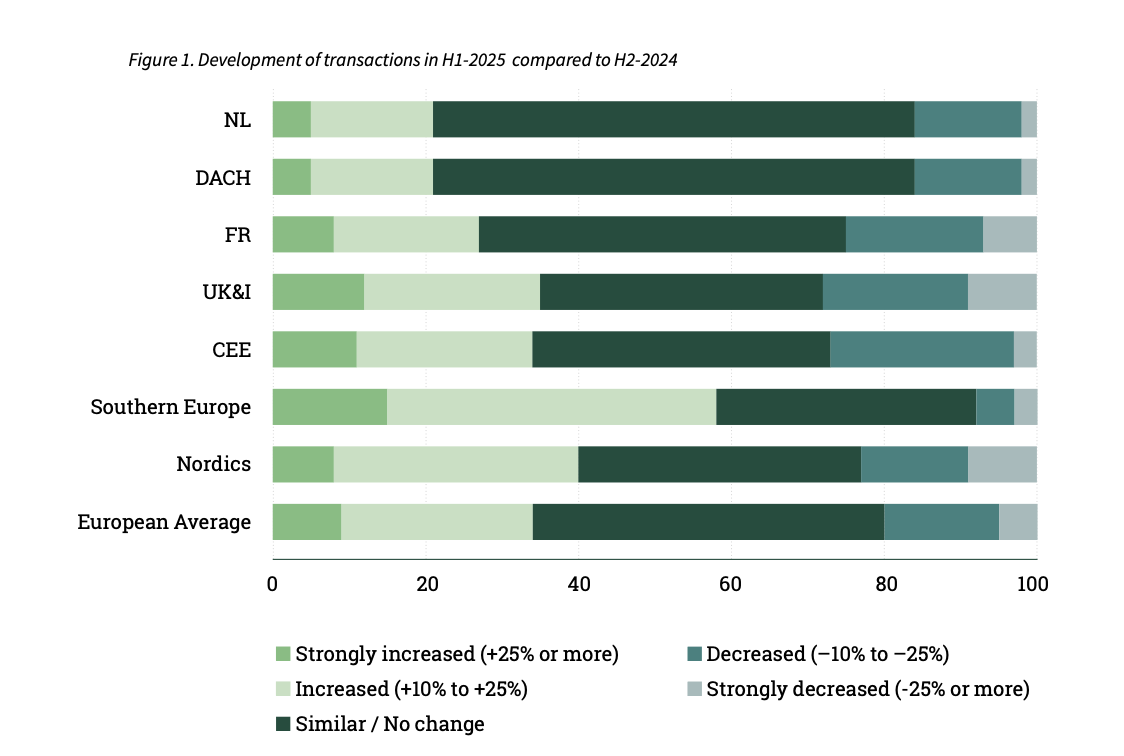
The European M&A market in H1-2025 showed relative stability, with 46% of respondents reporting no significant change in deal activity compared to H2-2024. 34% of advisors report an increase in the amount of transactions. Some regional differences stand out: the Nordics and Southern Europe recorded stronger increases in deal volume, while CEE and the UK & Ireland saw the largest declines.
The number of expected transactions in a sector is influenced by market, industry, and financing factors. To capture anticipated shifts, advisors were asked in which sector they foresee the largest increase or decrease in H2-2025. Each respondent could indicate one sector. These results are aggregated from seven regional M&A Monitors (France, DACH, CEE, Southern Europe, Nordics, Netherlands, and UK&I) and are presented here in two charts, showing the three sectors most frequently mentioned for an expected increase and decrease.
Across Europe, expectations for H2-2025 show strong optimism in Software Development and Industrial & Manufacturing, both cited in most regions as key growth sectors. Business Services, IT Services, and Healthcare also emerge as growth themes, though more regionally concentrated. On the downside, Retail Trade, Hospitality & Tourism, and Construction & Engineering are repeatedly identified as sectors likely to see weaker deal activity, while Automotive, Transportation & Logistics is also flagged in several regions.
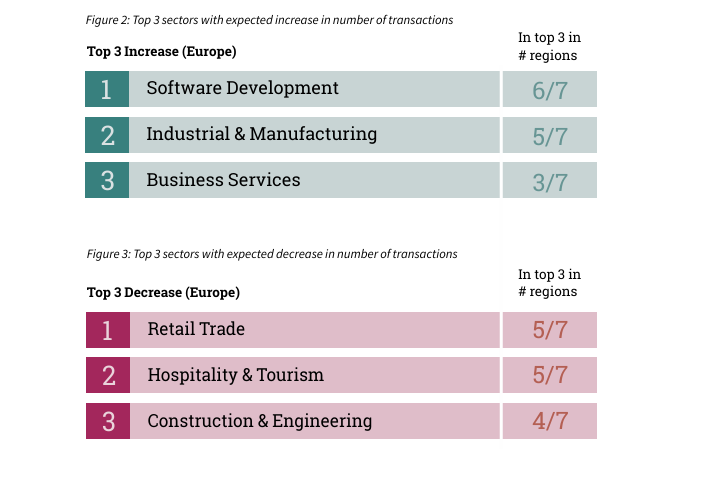
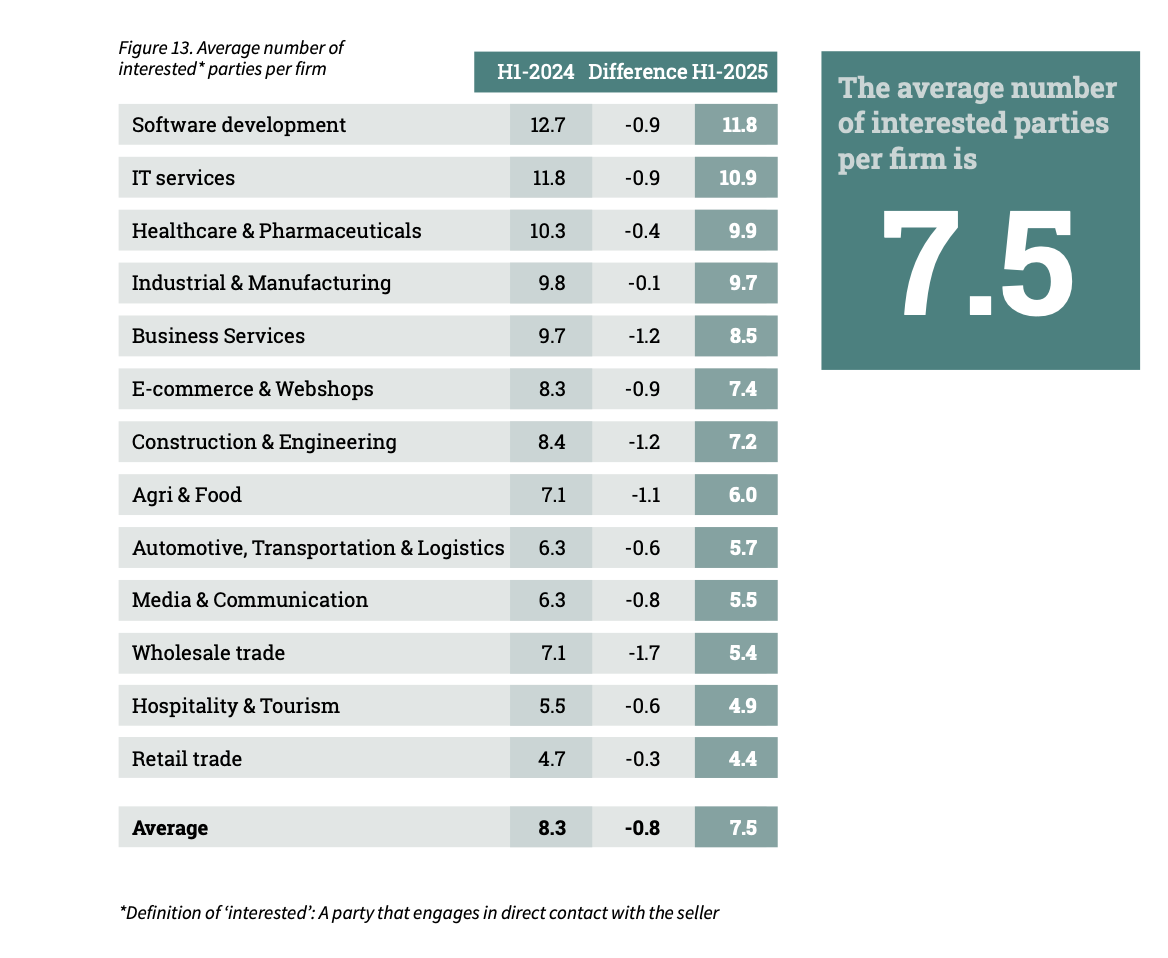
These sector expectations are consistent with the number of interested parties per firm shown in Figure 13 in the Buyer Intent chapter (page 15). The sectors forecast to grow already attract above-average buyer interest, while those expected to slow down show the lowest demand.
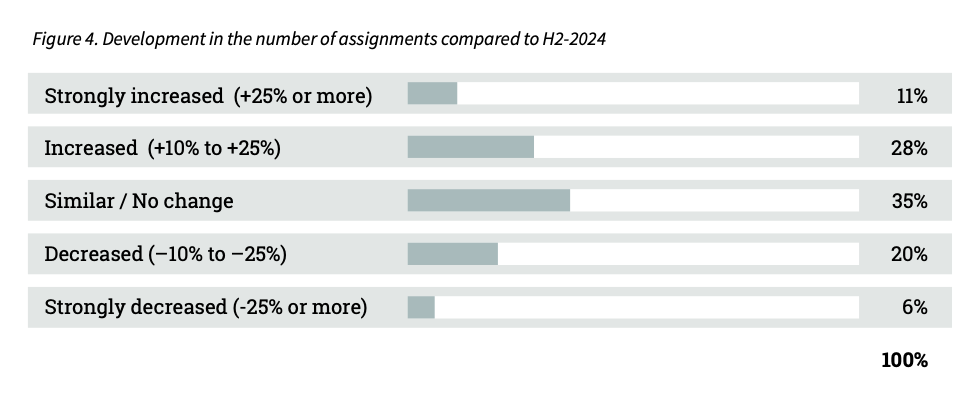
The results are shown in more detail in Figure 4 below. These figures represent assignments received and completed in H1-2025; however, it is important to note that some of these projects may still be ongoing or may be cancelled in later stages.
On average across Europe, 35% of advisors reported a similar number of assignments compared to H2-2024. Meanwhile, 26% observed a decrease, while 39% reported an increase, including 11% who saw a strong rise in deal assignments.
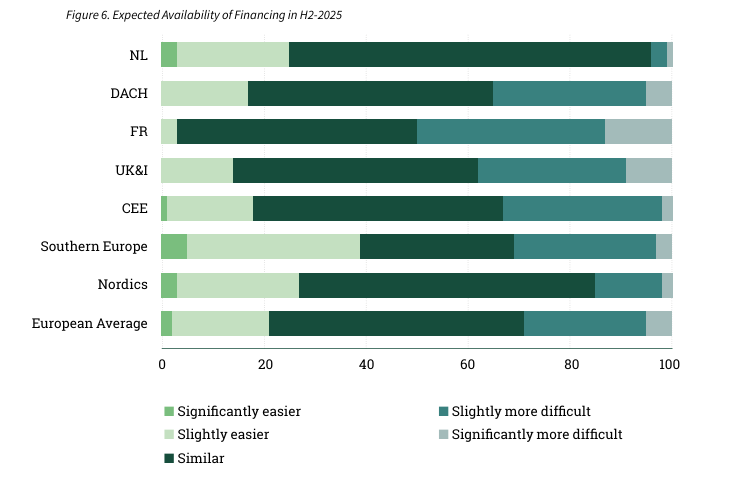
Advisors were asked to assess the availability of financing in H1-2025 compared to the previous half year. The results, presented in Figure 5, show that financing conditions across Europe have remained relatively stable overall, though notable differences exist between regions.
On average, 54% of advisors reported no change in financing conditions compared to H2-2024. 20% saw an improvement, with 2% noting financing had become significantly easier. Meanwhile, 26% experienced more difficult conditions. Regionally, the Nordics and Southern Europe reported easier access to f inancing, while DACH, CEE and France faced more challenges.

The differences in reported financing availability across Europe may reflect variations in local financial ecosystems. In some markets, the presence of a broader range of lenders can help maintain stable or even easier financing conditions, while in others, a greater reliance on fewer funding sources may lead advisors to experience tighter availability. These patterns suggest that financing conditions are shaped not only by broader macroeconomic factors but also by regional market structures.
Advisors were also asked about their expectations for financing conditions in H2-2025. On average across Europe, 21% expect an improvement, while 29% anticipate more difficult conditions. Half of respondents (50%) believe financing availability will remain unchanged. Regionally, the Netherlands, the Nordics, and Southern Europe stand out with a more optimistic outlook, whereas France, DACH, and UK & Ireland show greater concern about tighter financing conditions in the coming half year.
In the first half of 2025, the number of received M&A assignments increased most strongly in Southern Europe and CEE, where 58% of respondents reported a rise compared to the second half of 2024. France, the Nordics, and the Netherlands also performed well, showing above-average increases. The DACH region remained stable, with an equal share of firms reporting increases and decreases. In contrast, UK & Ireland saw more firms indicating a decline.
Company valuations are inherently specific and depend on factors such as growth, profitability, market position, and risk. While a multiple alone is not a complete valuation method, it provides a useful benchmark, particularly for comparing similar transactions in the near term.
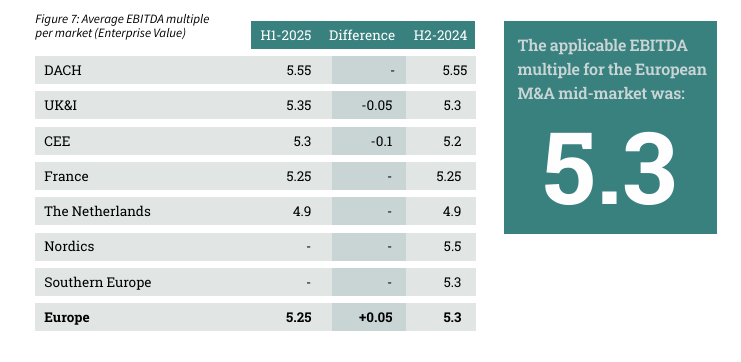
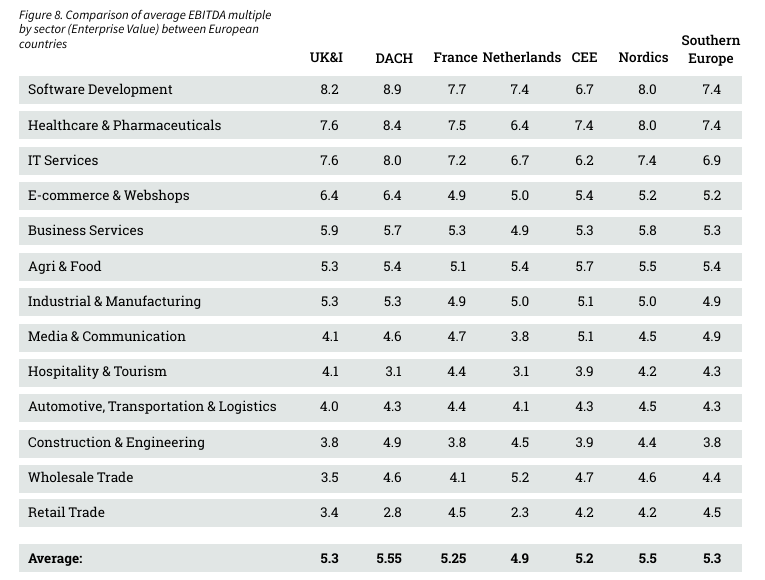
Sell-side advisors defined the average EBITDA multiple by industry. In this edition, we asked them to revise the industry multiples from H1-2025. The results are shown in Figures 7 and 8.
The average European EBITDA multiple stands at 5.3 in H1-2025. At the regional level, developments were mixed. The UK & Ireland saw a small decline (–0.05 to 5.3), while CEE recorded the largest drop (–0.1 to 5.2). DACH (5.55), France (5.25), and the Netherlands (4.9) remained stable over the same period.
For the first time, this edition also includes data for the Nordics (5.5) and Southern Europe (5.3). When looking at the average EBITDA multiples of the various European regions, it becomes clear that regional differences exist. Parties that are aware of these differences, can use this to their advantage.
The Software Development sector continues to command the highest EBITDA multiples across Europe, with particularly strong valuations in DACH (8.9) and UK&I (8.2). The Nordics also report high levels (8.0), while CEE (6.7) remains lower. A similar pattern is evident in Healthcare & Pharmaceuticals, where DACH (8.4), UK&I (7.6), and the Nordics (8.0) lead the market.
At the other end of the spectrum, Retail Trade has the lowest multiples, with DACH (2.8) and the Netherlands (2.3) standing out. Hospitality & Tourism also shows notable regional differences, ranging from 3.1 in DACH and the Netherlands to 4.4 in France. Meanwhile, sectors such as Agri & Food remain relatively consistent across markets, with averages clustering between 5.1 and 5.7.
These variations highlight the regional pricing dynamics and sector-specific trends that shape European mid-market valuations, providing valuable insights for buyers and sellers when considering cross-border M&A opportunities.
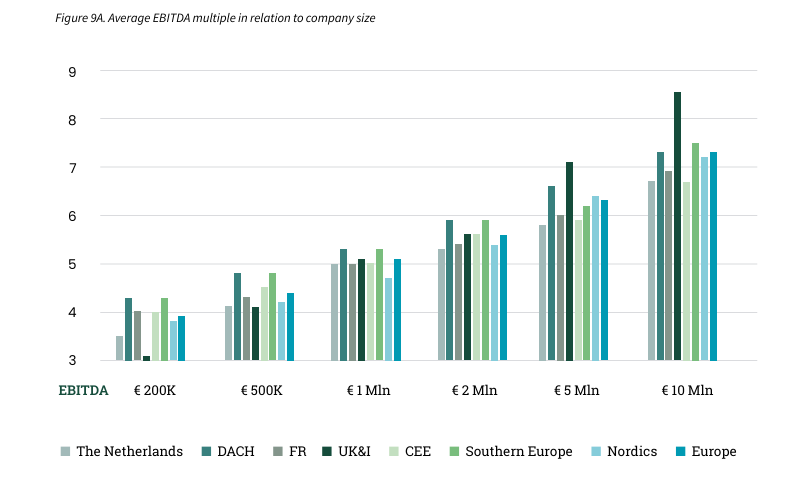
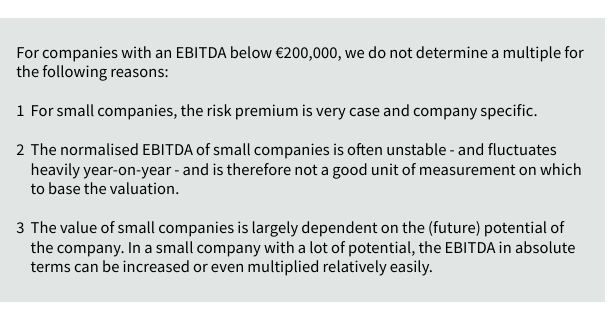
Company size is a decisive factor in shaping valuation multiples across Europe. For small and medium sized enterprises (SMEs), assessing the effect of the so-called Small Firm Premium is particularly important, especially for businesses with EBITDA between €200,000 and €10,000,000.
Research (Damodaran, 2011; Grabowski & Pratt, 2013) has shown that smaller firms face a greater risk of missing projected cash flows. This often stems from dependencies on a limited customer or supplier base, or on specialized know-how that can quickly disappear if key employees leave.
These vulnerabilities can have a strong effect on returns and, in turn, on valuations. The higher risk premium applied to smaller companies, known as the Small Firm Premium, reduces their value, meaning that larger businesses generally achieve higher EBITDA multiples.
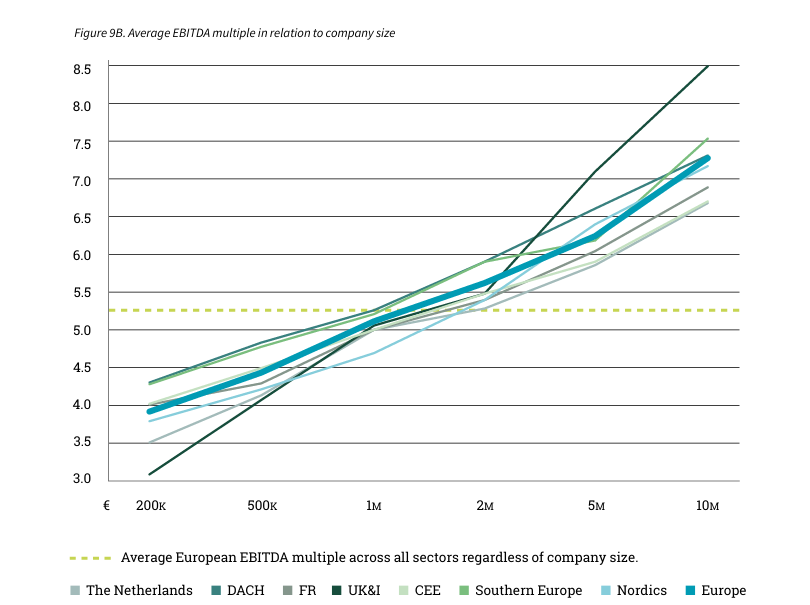
The findings of this survey once again confirm this relationship: companies with lower EBITDA are sold at lower multiples than those with higher EBITDA. Figures 9A and 9B further illustrate the influence of company size on EBITDA multiples.
On average, the gap in EBITDA multiples between firms with a normalized EBITDA of €200,000 and those with €10,000,000 is 3.4 (3.9 versus 7.3). The widest spread is found in the UK & Ireland, where companies at €200,000 EBITDA trade at multiples of 3.1, while those at €10 million EBITDA reach 8.5, a difference of 5.4.
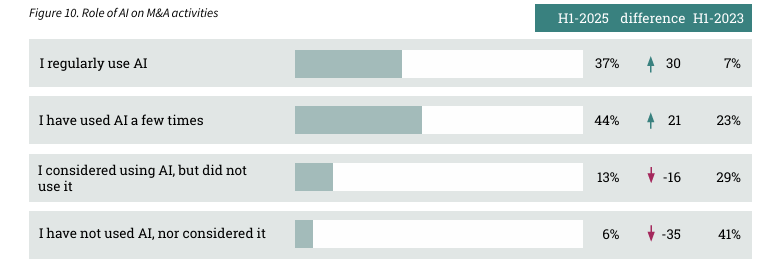
In H1-2023, only 7% of European advisors reported using AI on a regular basis; by H1-2025 this share had surged to 37%. Occasional use also rose strongly, from 23% to 44%. Over the same period, the proportion of advisors who had not used AI at all dropped sharply from 41% to just 6%, while those who had merely considered it without applying it fell from 29% to 13%.
This shift shows that in just two years, AI has evolved from a niche tool to a widely embedded part of European mid-market M&A practices.
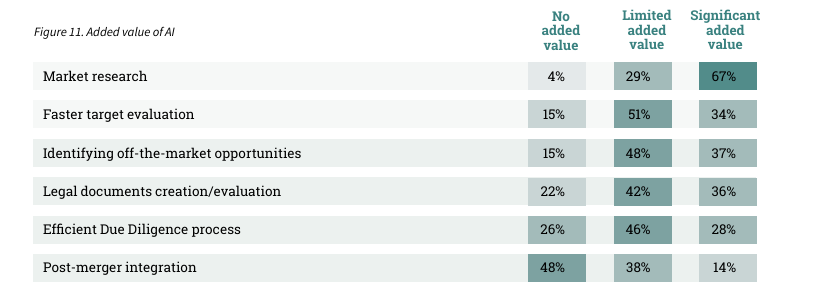
In H1-2025, AI is considered most valuable in market research, with 67% of European advisors reporting significant benefits and only 4% seeing no added value. Legal document creation and evaluation, identifying off-market opportunities, and faster target evaluation are also viewed positively: in each case, more than 70% of respondents noted at least some added value, although fewer rated the impact as significant.
In due diligence, the picture is more mixed. Just 28% of advisors reported strong benefits, while nearly three-quarters saw limited or no added value. Post-merger integration is clearly the area where AI adds the least value, with almost half of respondents (48%) reporting no added value.
Deal terms continue to evolve in response to changing market conditions. At the European level (Figure 12), earn-outs show the strongest movement: 42% of advisors reported an increase in their use, while only a small minority observed a decrease.
More broadly, several deal terms have seen rising application, pointing to a clear shift towards greater risk sharing between buyer and seller in today’s uncertain environment.
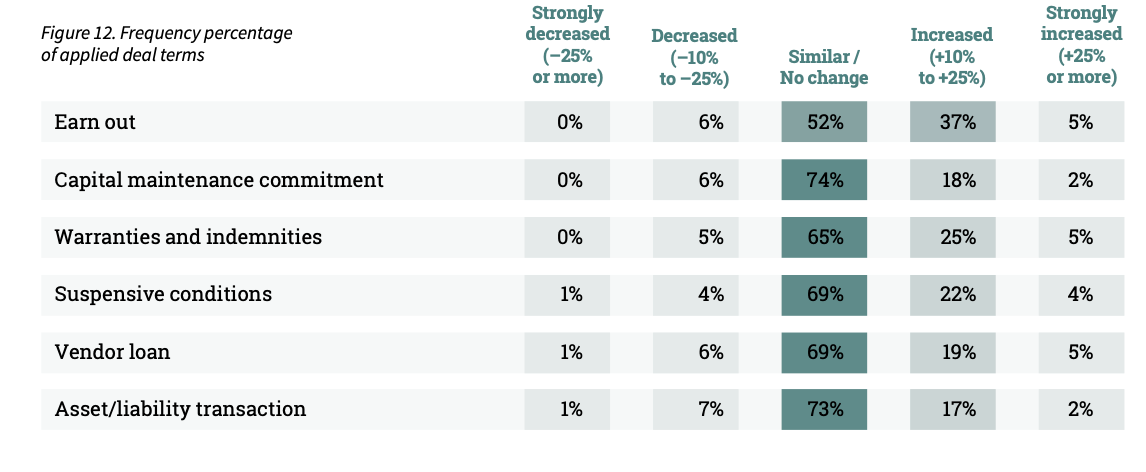
Earn-outs are on the rise in several European regions. In the Nordics, 55% of M&A advisors observed an increase in the use of earn-outs, while a similar trend was reported in Southern Europe (53%). In contrast, only 26% of advisors in France noted a rise in earn-out usage.
CEE, however, stands out in the adoption of capital maintenance commitments, with 44% of advisors indicating an increase. This contrasts sharply with the Nordics, where 94% of advisors saw no change in their use. In France, 37% of advisors also reported a rise in capital maintenance commitments.
The M&A market continues to operate as a “seller’s market,” with demand outpacing supply across most sectors. The balance between the two, however, varies considerably by industry. To capture these dynamics, M&A advisory firms were asked to indicate the demand-to-supply ratio for each sector, on average, how many seriously interested parties contact the seller for every business on the market. The results are presented in Figure 13.
In this edition, averages for Southern Europe, CEE and the Nordics are included for the first time, providing a more complete European picture. Compared with H1-2024, the average number of interested parties per business has declined from 8.3 to 7.5. Software Development and IT Services continue to attract the highest levels of buyer interest.
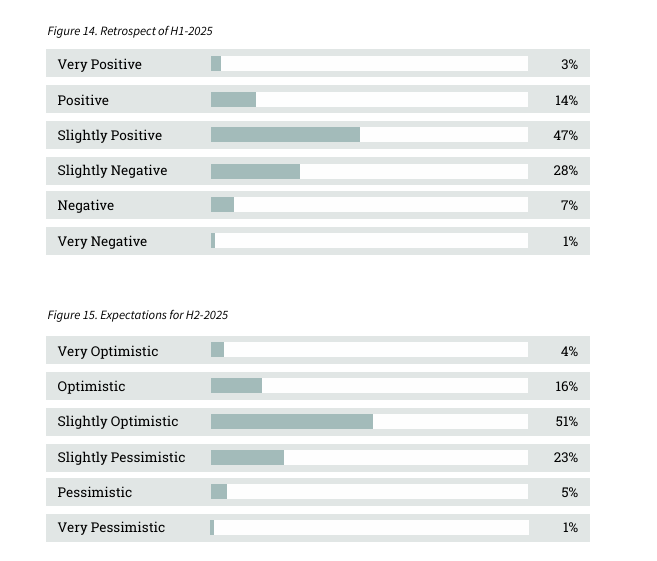
Assessing the performance of the European M&A mid-market is based on many factors, including the willingness of entrepreneurs to sell their businesses, funding availability, macroeconomic developments etc. An interpretation of these factors is needed to determine how the market will develop. The survey included both assessments of the M&A mid-market in H1-2025 (retrospective) and H2-2025 (projection).
The advisors were asked to evaluate the performance of H1-2025. The majority of advisors were satisfied with the performance of the first half of the year (64%), while 36% of advisors had a negative feeling about H1-2025. Looking at the expectations for the second half of 2025, 71% of respondents have optimistic expectations.
The majority of M&A transactions take place in the mid-market. This M&A Monitor uses the definition of a mid-market company as having a revenue between 1 and 200 million euros.
Dealsuite maintains direct and ongoing contact with thousands of M&A advisory firms, ranging from boutique firms to large-scale advisory firms. For this research, 828 key mid-market M&A advisory firms across Europe provided input. These firms provide critical insights into private transactions in the European mid-market, which are often undisclosed or not widely shared. This extensive network offers unparalleled visibility into the otherwise opaque M&A mid-market.
The quantitative conclusions in this report are based on the expertise and in-depth contributions of participating M&A advisory firms, supported by transactional data from the deals they collectively executed in H1-2025, along with proprietary Dealsuite data and reports.
The quantitative conclusions in this report are based on:
• In-depth contributions from 828 leading European M&A advisory firms
• Dealsuite transaction data 2015-2025
• Dealsuite M&A Monitors 2015 - 2025
This study is further supported by separate regional Dealsuite reports, analyzing the mid-market M&A landscape in the CEE, DACH, UK&I, France, Southern Europe, the Nordics and the Netherlands.
Additional sources used:
• Bain & Company. (2023, March 28). How companies got so good at M&A.
• Dealsuite M&A mid-market trends report 2025
• Field, A. (2011) Discovering Statistics SPSS. Third edition, SAGE publications, London. 1 -822
This research was conducted by Jelle Stuij and Roos Bijvoet. For further questions, please contact Jelle Stuij.


.png)


Grow your network. Find more deals.
Science Park 106
1098 XG Amsterdam
Netherlands
© 2026 Dealsuite. All rights reserved.


.png)